Use case
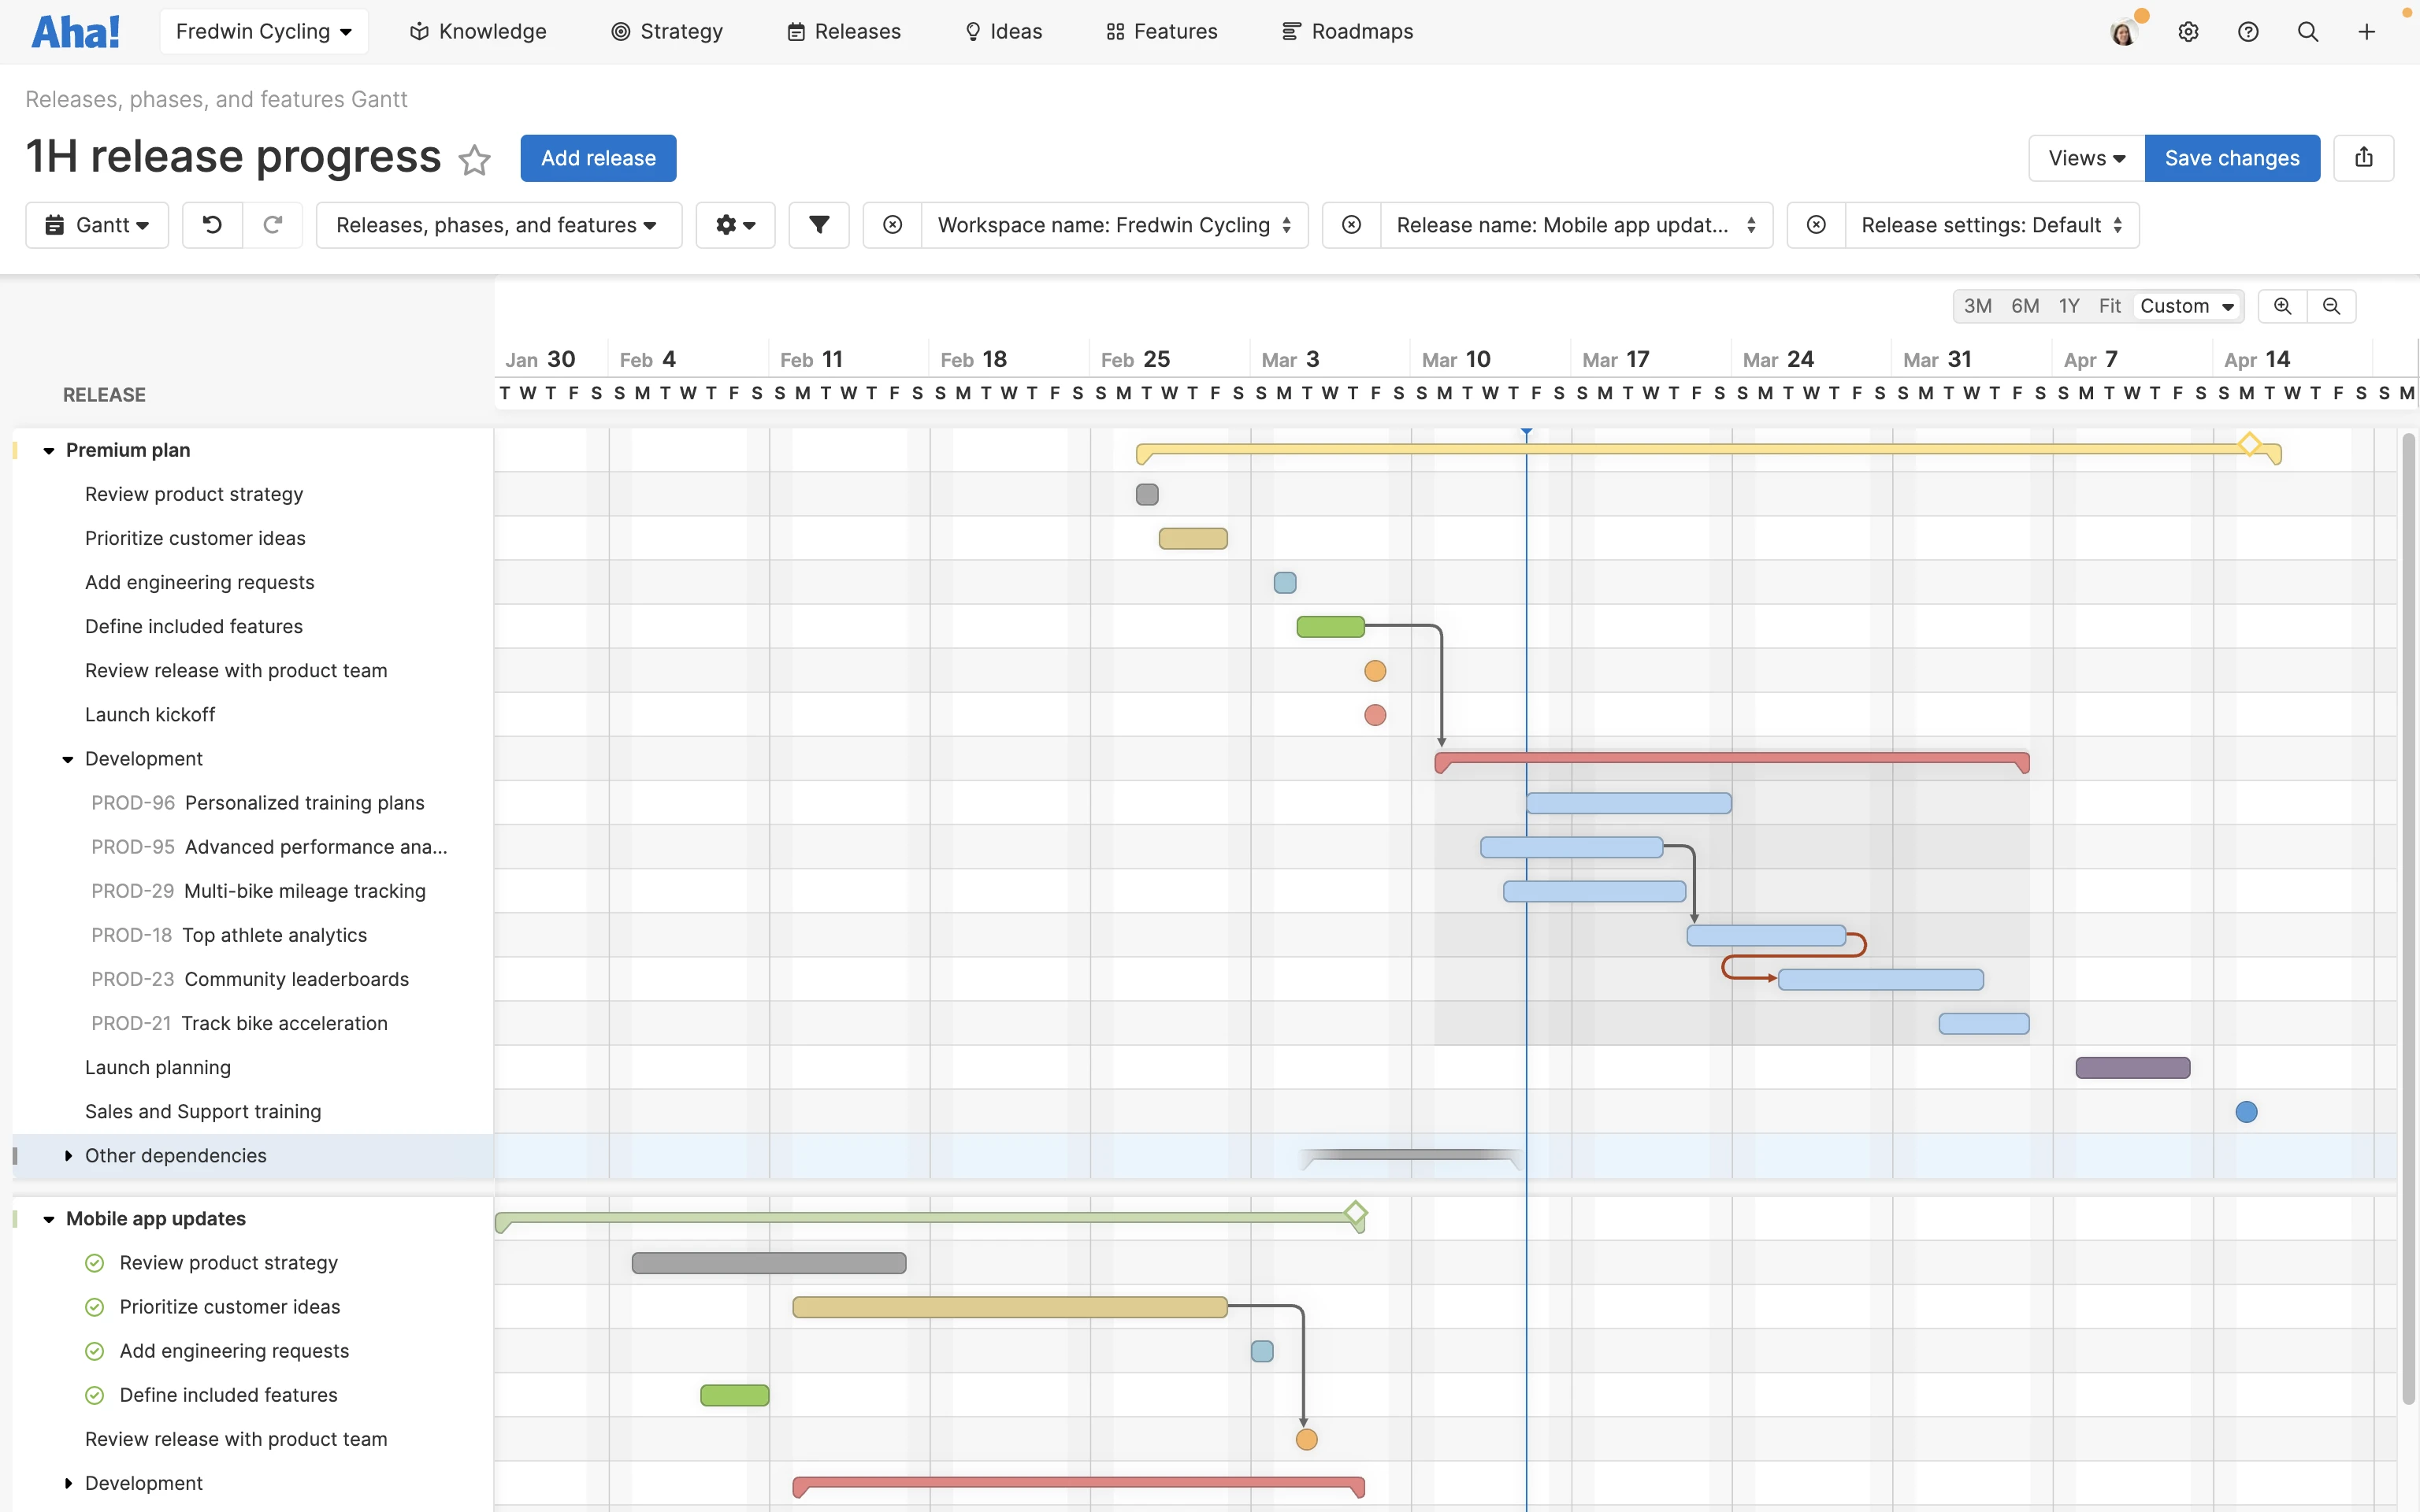
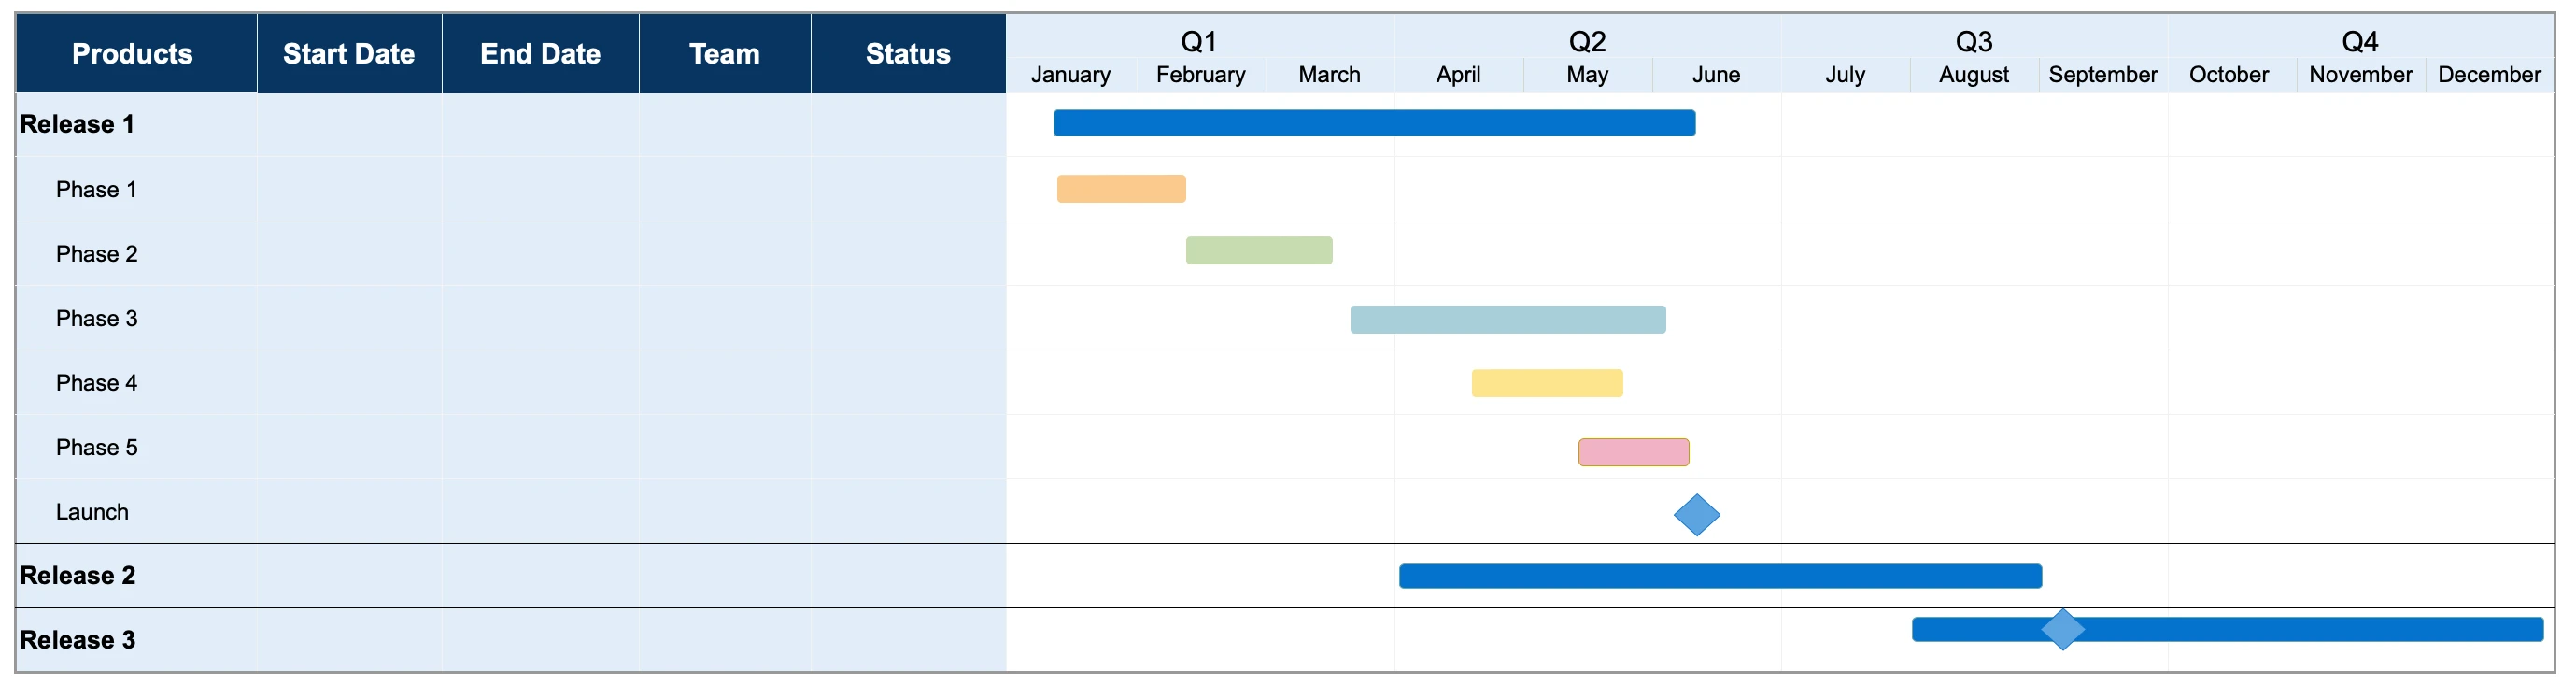
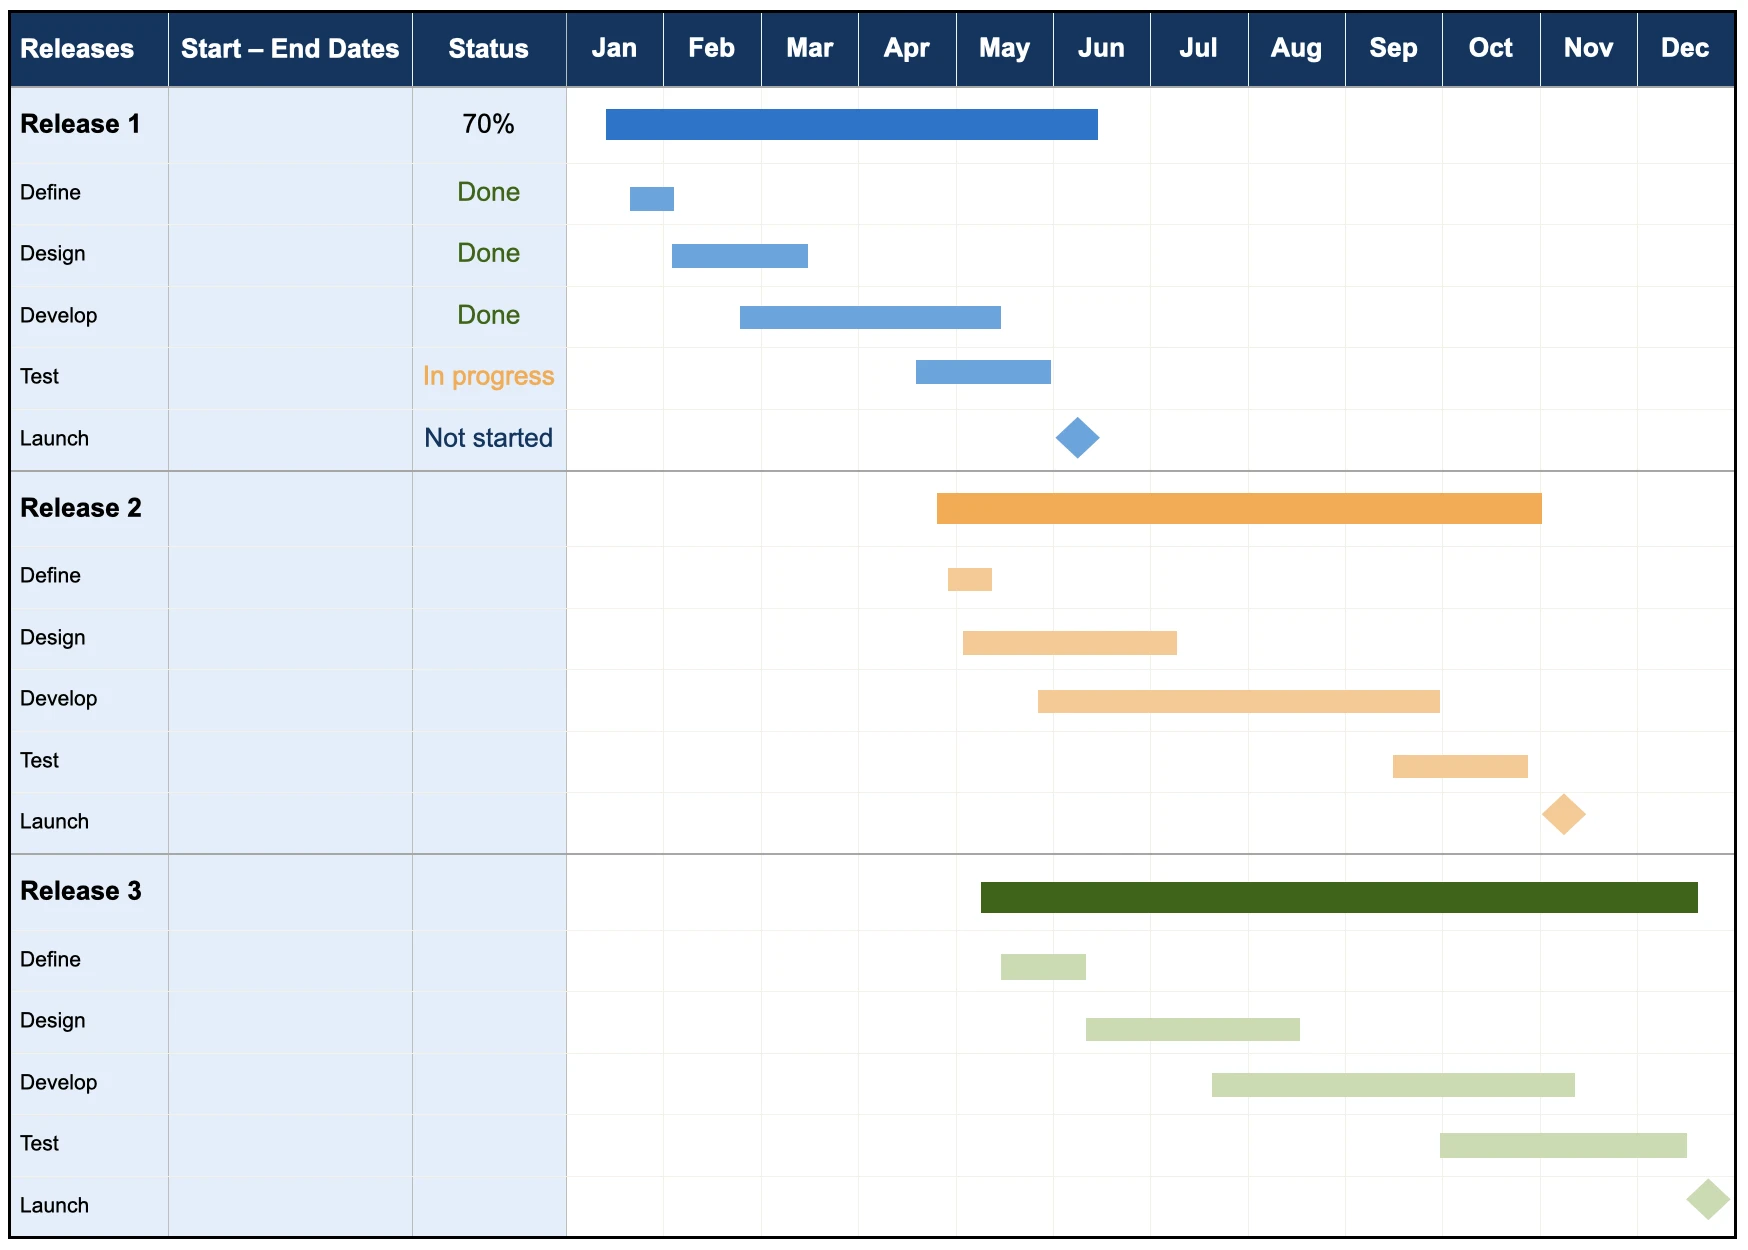
The next Gantt chart shows key activities that make up an overall release plan. You can track the status of each task by changing the color of the bar and show dependencies between tasks.
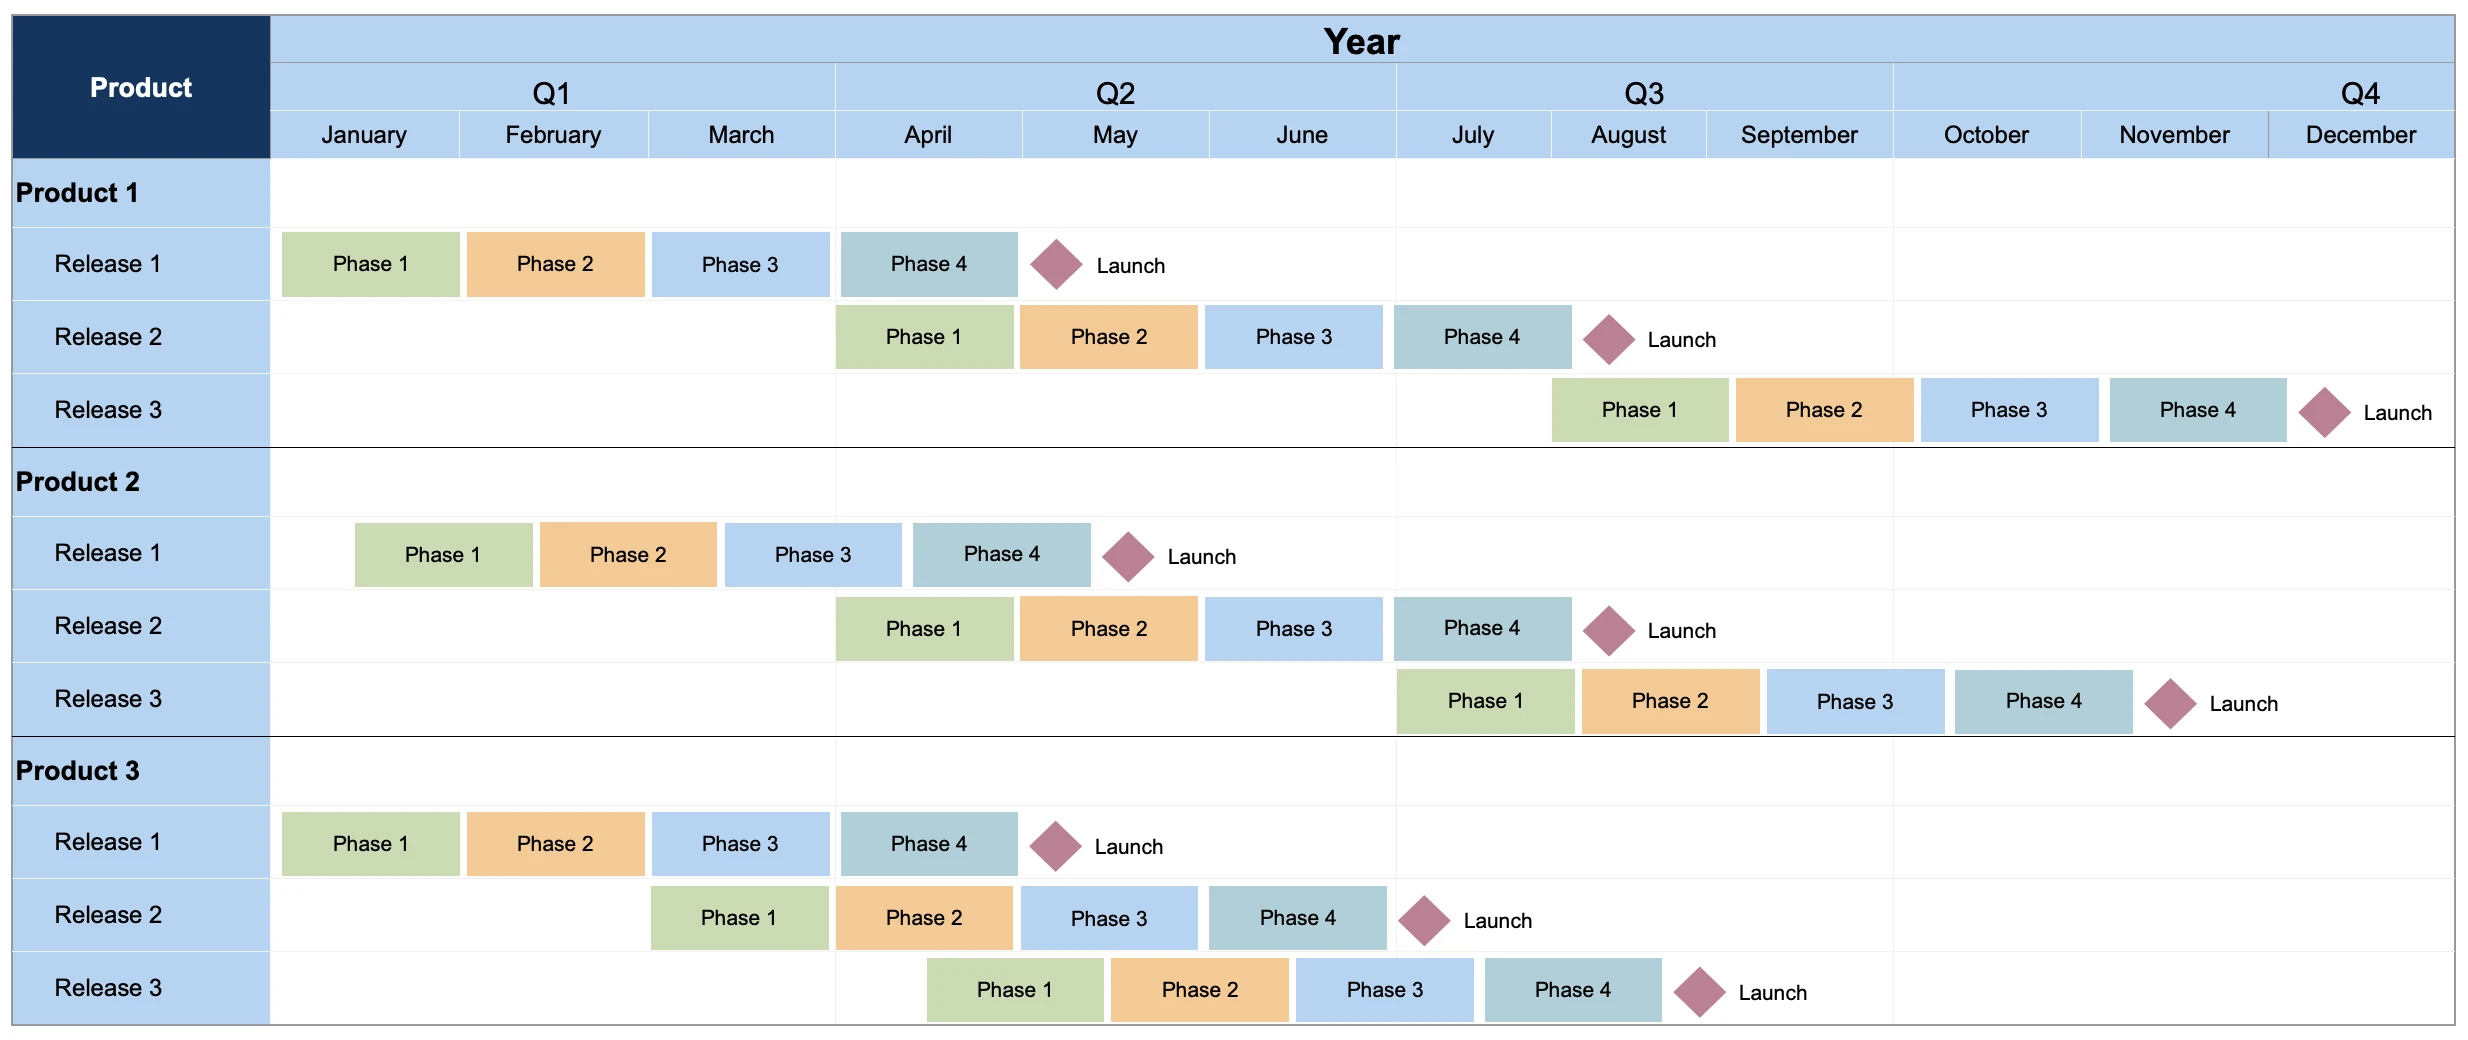
Use case
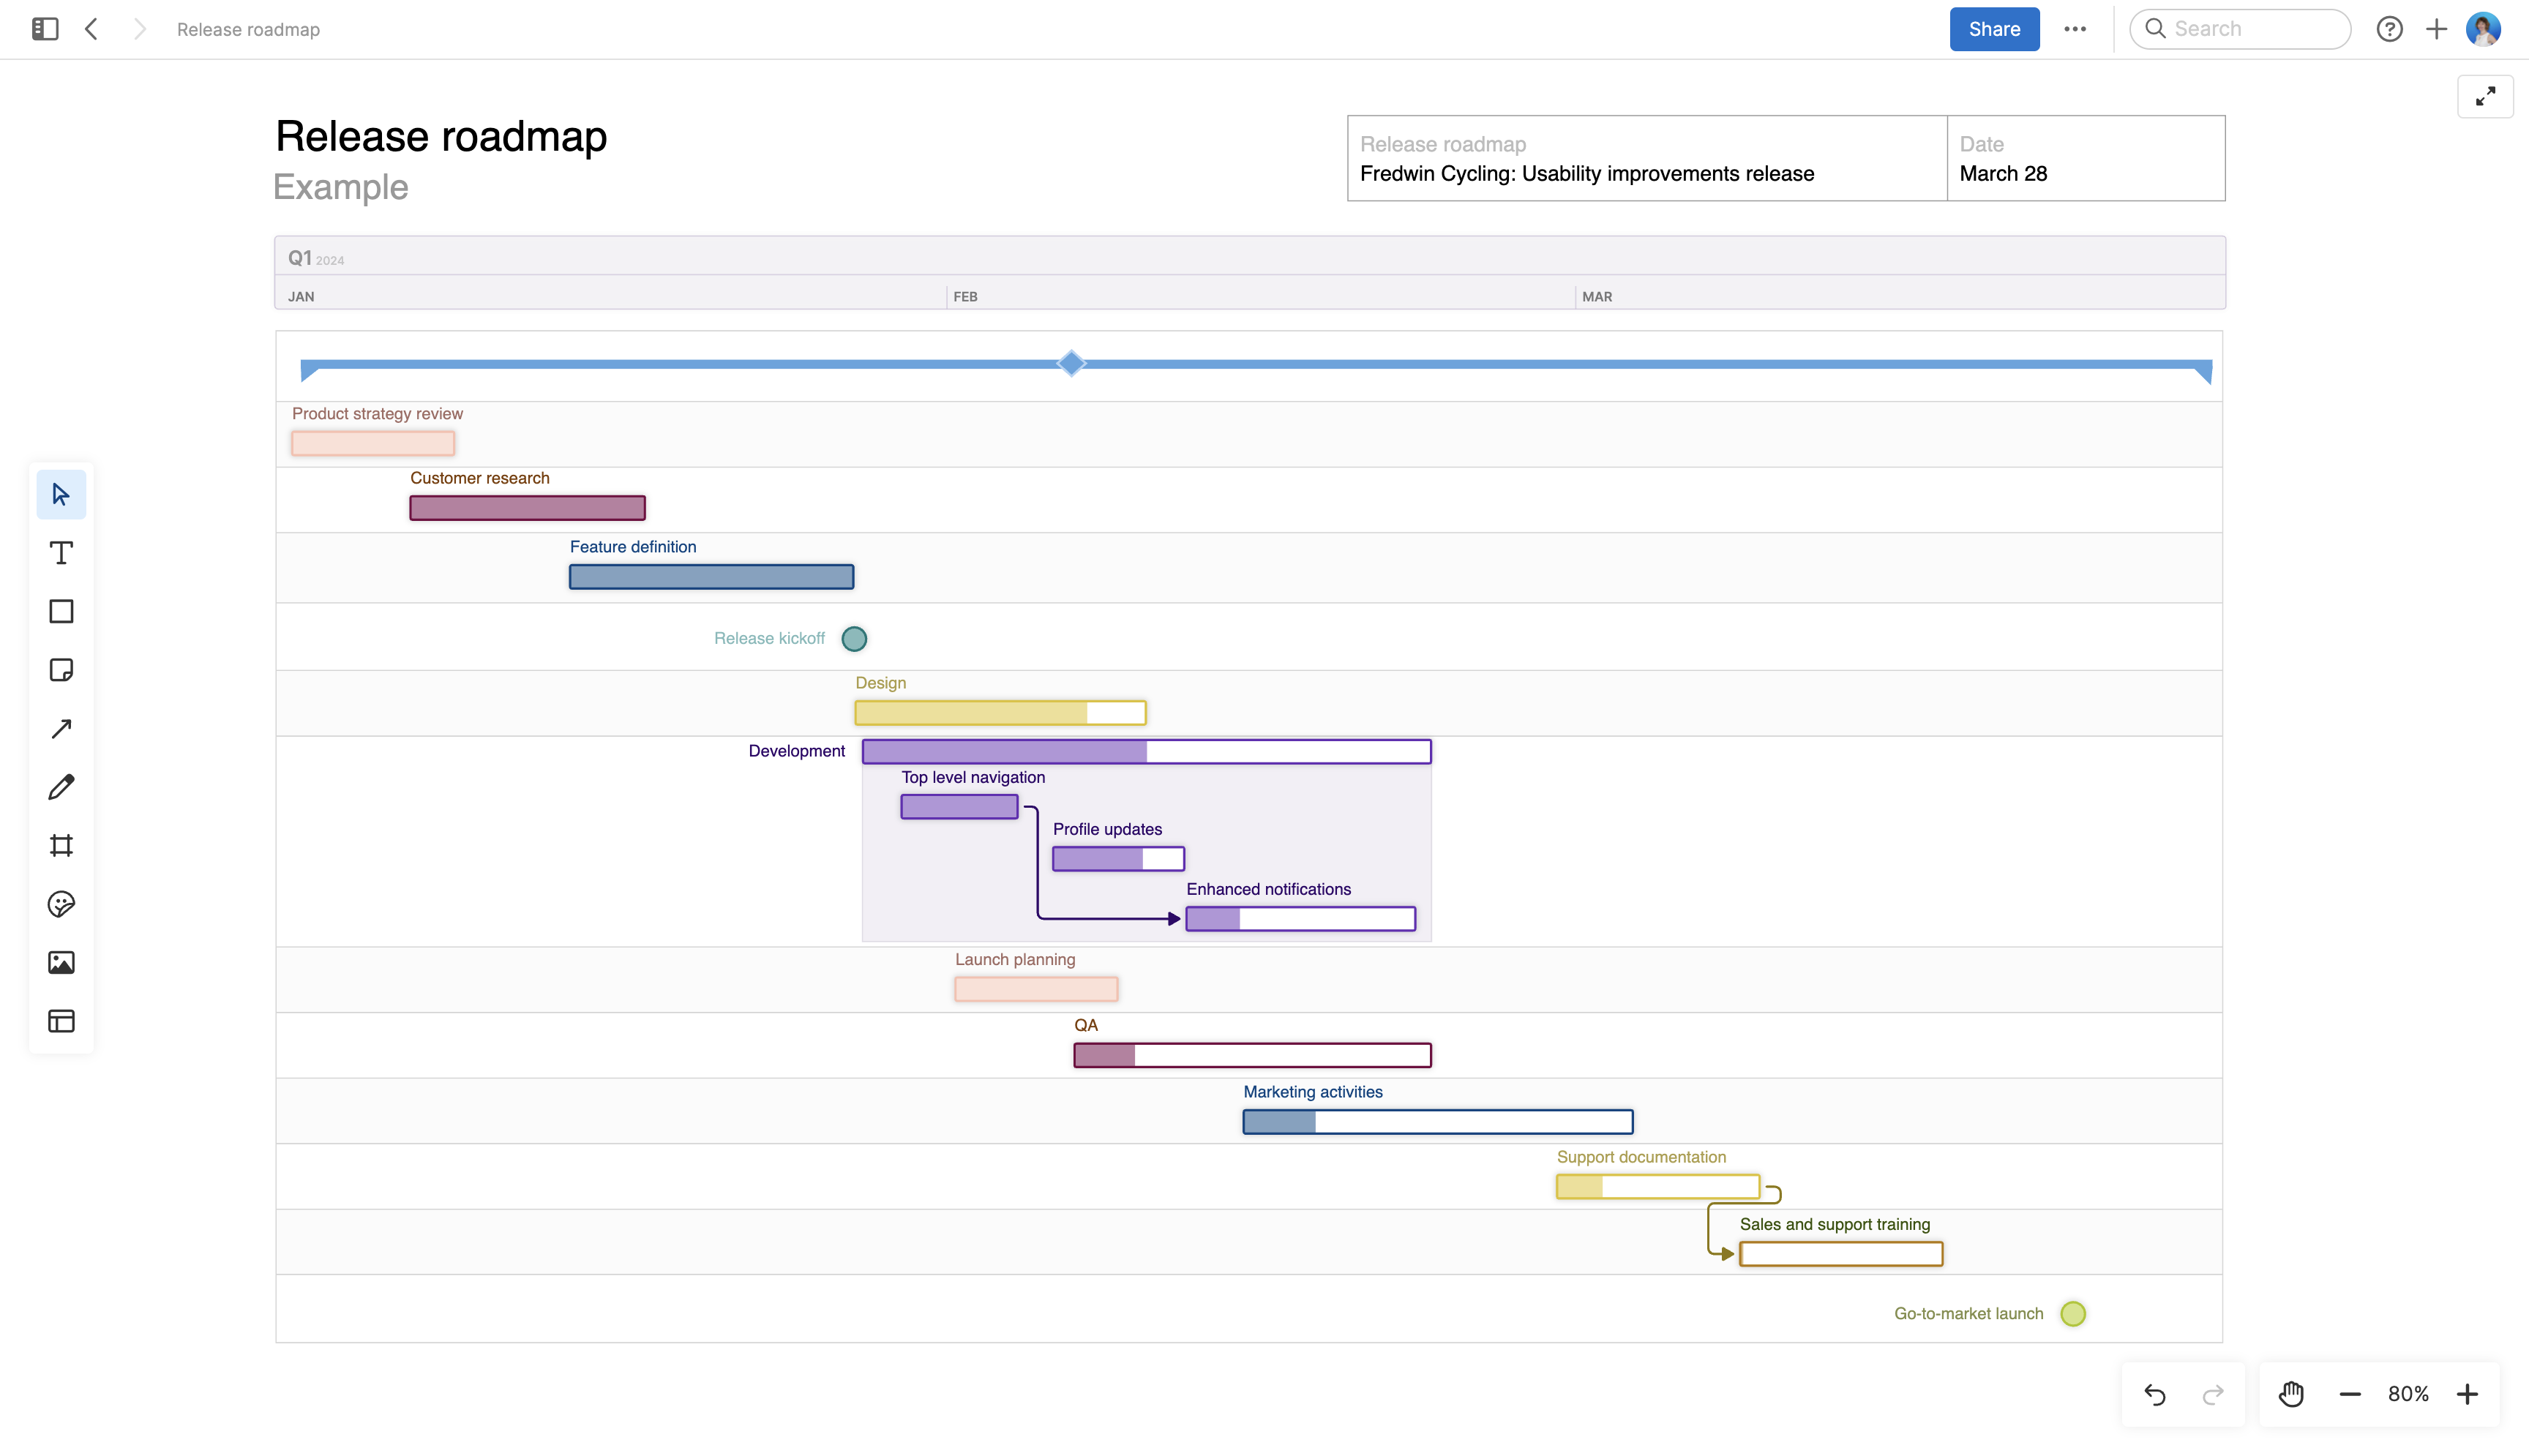
This next release template is perfect for agile product managers and agile development teams. It allows you to visualize your sprint schedule and show the user stories that will be completed in each sprint. You can also include milestones, such as sprint planning and review meetings.
Project management Gantt chart templates
Overview
Gantt charts can also be used to manage a wide variety of project management tasks. Project managers can use them, for example, to plan a user research effort, trial onboarding project, or customer advisory board. They make it simple to keep track of all the task lists that need to be completed. Choose from a variety of timelines to reflect your project planning horizon.
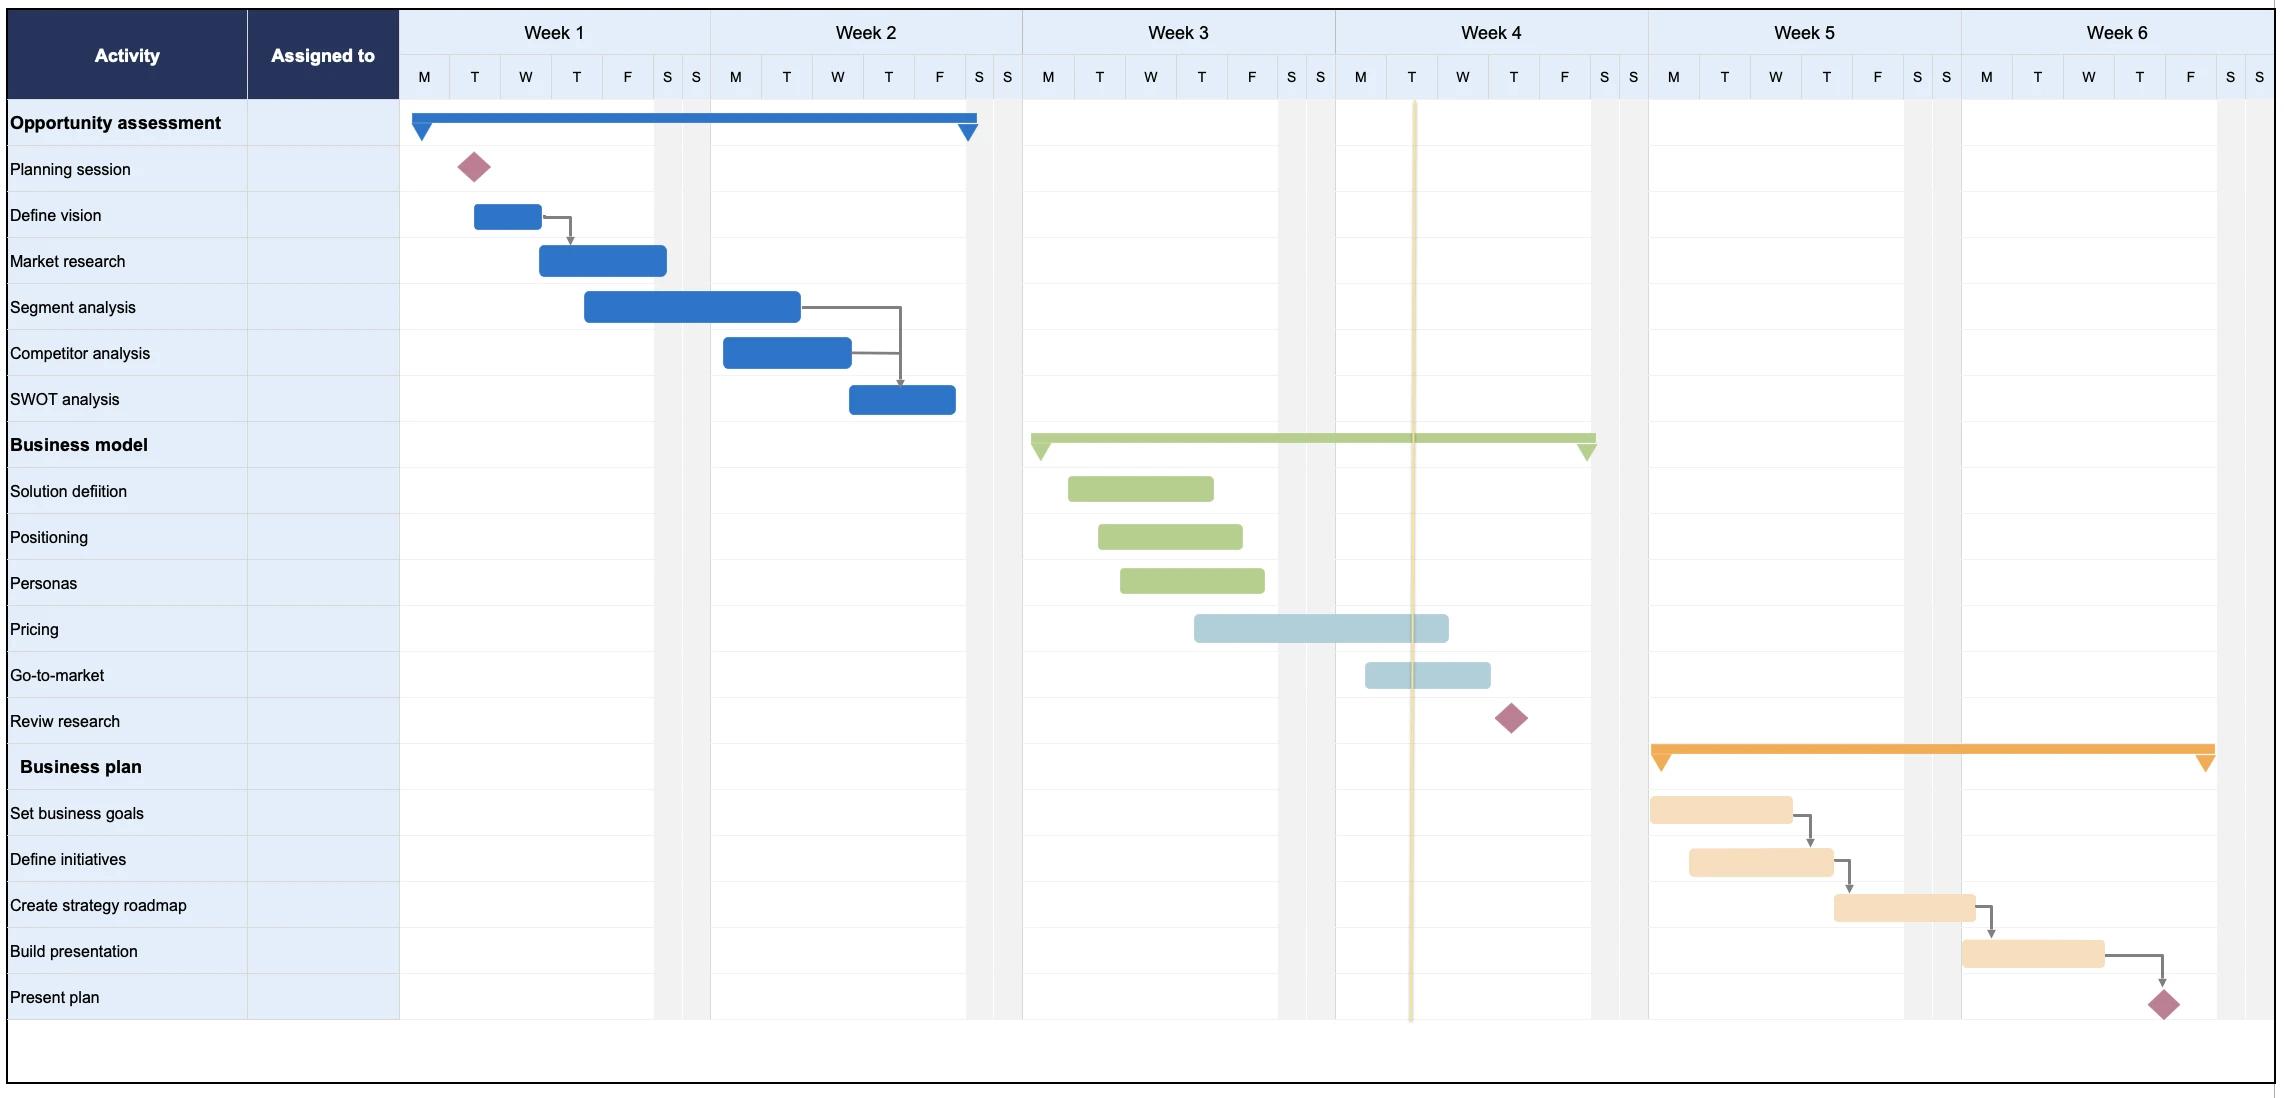
Use case
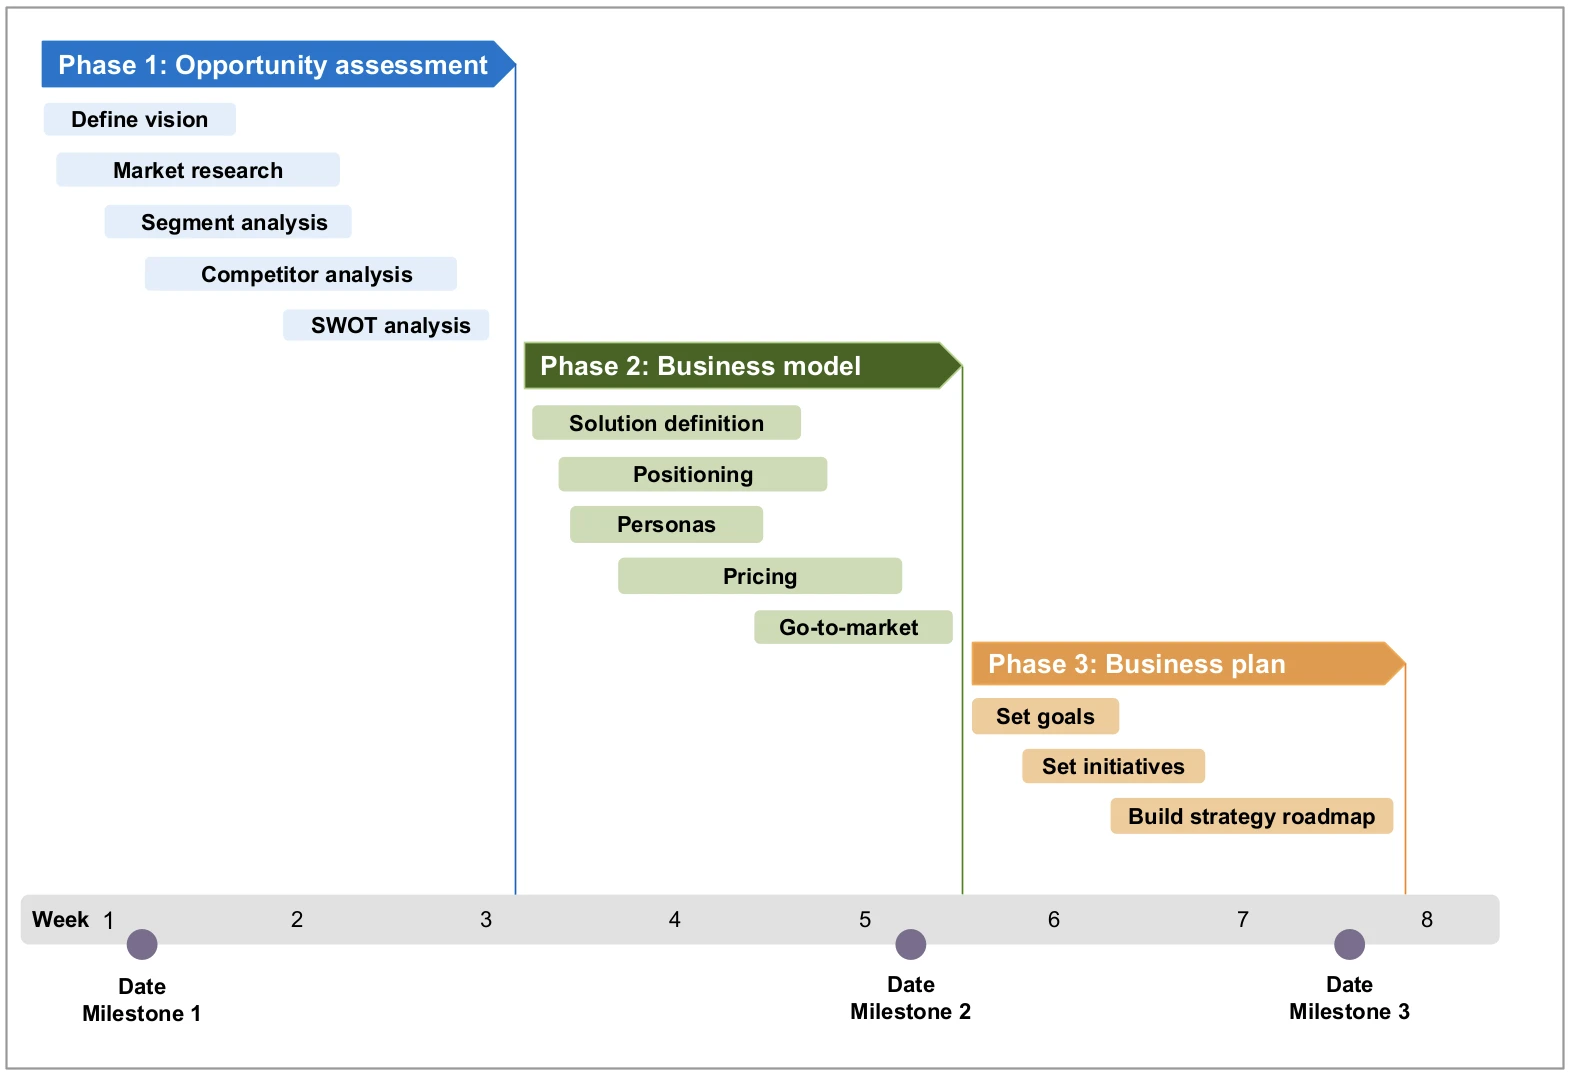
This project management Gantt chart template uses a weekly timeline to track important tasks that need to be completed. You can also break tasks into sub-tasks and show the order they need to be completed in.
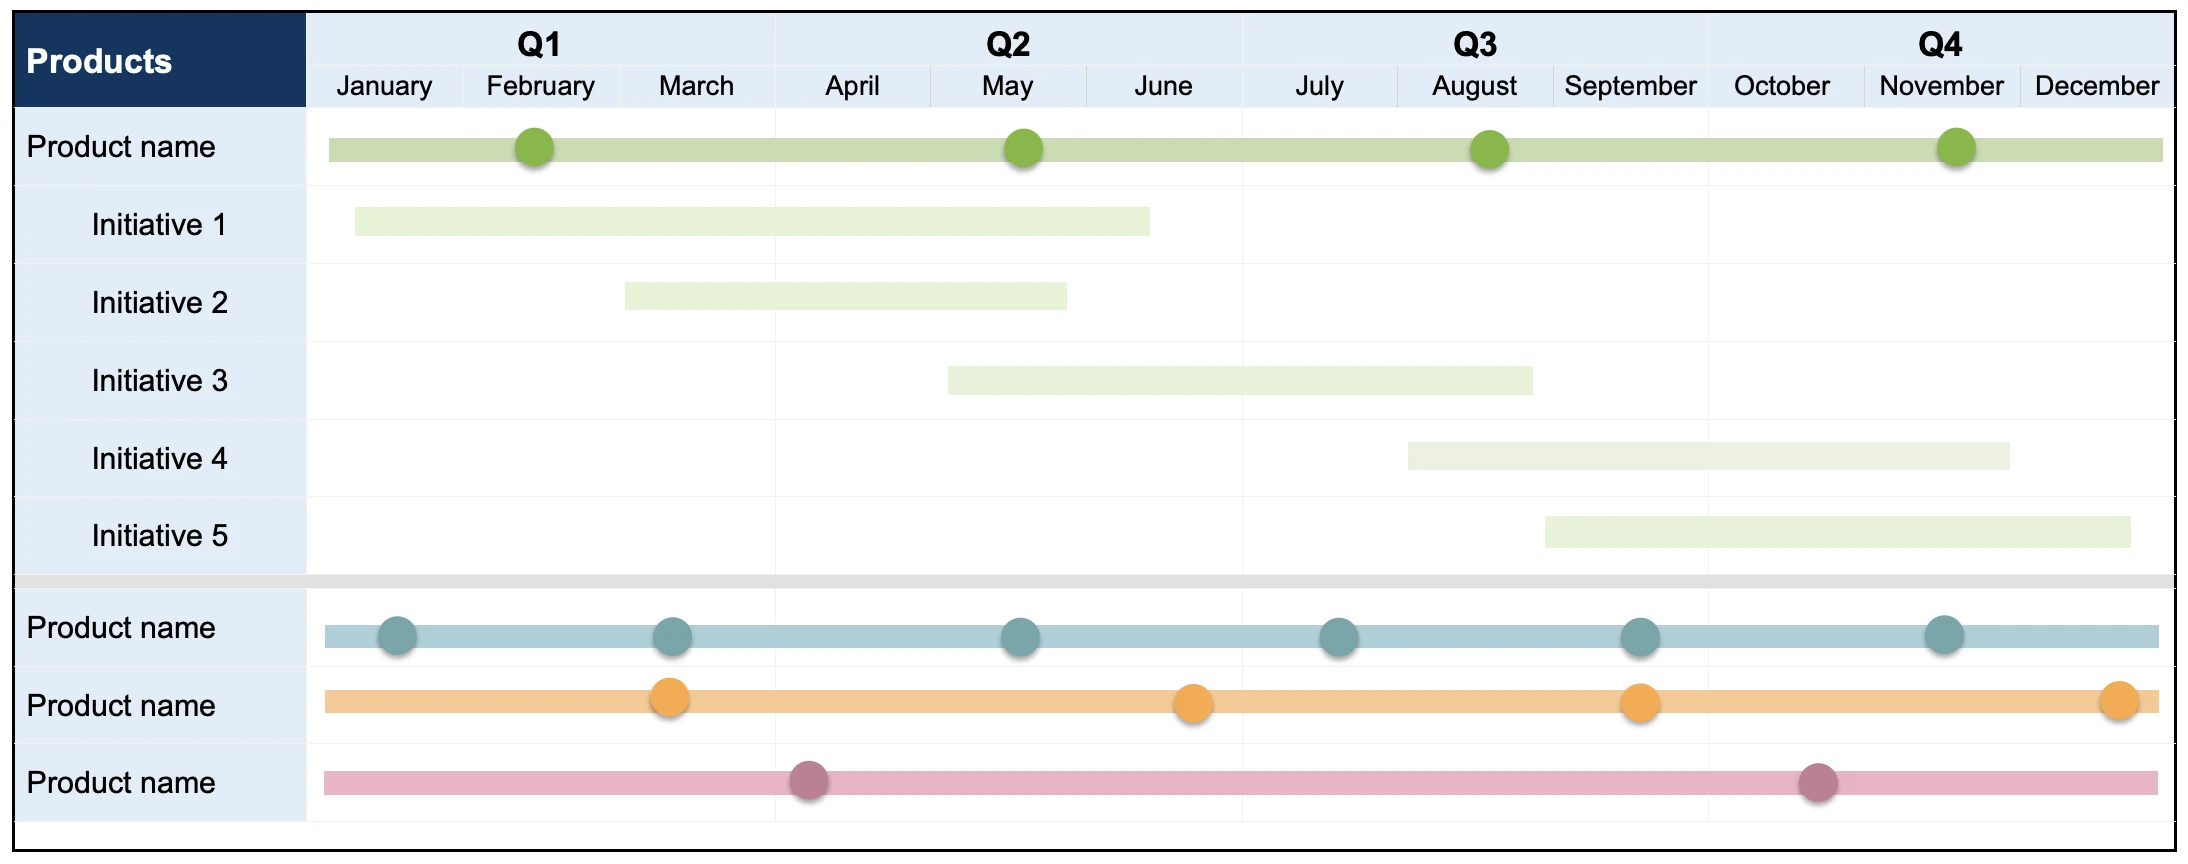
Use case
This Gantt chart template provides a simple way to track the task list that needs to be completed each week. You can shade each bar to represent the percent completed.
Related:
Top
Do you need a Gantt chart template?
The success of any new product development process relies on a clear plan that everyone can rally behind. This is why business leaders, product managers, and project managers commonly use Gantt calendars and diagrams — to give cross-functional teams an overview of upcoming work and align everyone around the timing of the plan.
Gantt charts are also useful for planning any type of time-driven or collaborative effort. Consider using a Gantt chart if you are:
A business leader defining a company strategy, refreshing a business plan, or planning to enter a new market.
A product manager planning product releases and features.
A product marketer coordinating cross-functional plans to launch a new product or release new functionality to market.
A project manager working with development teams to deliver product requirements on a set schedule
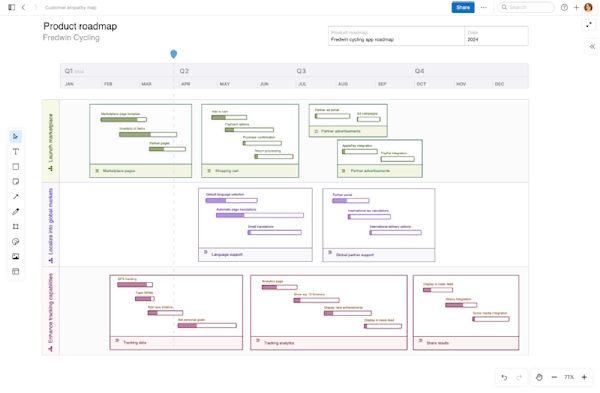
Some teams that follow agile software methodology view Gantt charts as a relic of waterfall. This is why many agile teams use roadmaps instead of Gantts to visualize and communicate upcoming plans. But it is important to understand that both roadmaps and Gantt charts can actually be valuable (and even complementary) tools. Use a roadmap to capture the high-level strategy and a Gantt chart to show a more detailed view of the work — the phases, tasks, and milestones that the product and engineering teams must complete to achieve that strategy.
Related:
Top
Common pitfalls when creating Gantt charts
Gantt charts are powerful tools. But they lose their potency as soon as they become inaccurate, outdated, or overly complicated. In order to create the most effective Gantt charts, you need to feel confident about your approach to building, using, and maintaining your own Gantt sheets.
Here are some best practices to keep in mind:
Keep your Gantt chart up-to-date.
Since Gantt charts are based on schedules and timelines, they are only useful if they convey accurate dates.
Keep your Gantt chart simple.
Gantt charts can quickly become too complex — especially if you are managing multiple products or projects in one sheet without advanced filtering options.
Keep your Gantt chart flexible.
Choose a Gantt chart template or tool that is simple to modify. When plans or dates change, you need to be able to adjust your Gantt chart quickly and easily.
Top
Gantt chart software for major cross-functional efforts
If you are new to using Gantt charts, the free Gantt chart Excel and PowerPoint templates included in this guide are a good place to start. You can quickly build a new chart to visualize strategic business, product, and project plans. But if you are working in an organization with a large product portfolio or collaborating with multiple teams cloud-based Gantt chart tools such as Aha! Roadmaps will be more effective.
You can view Gantt charts for all products, teams, and initiatives in one central location. You can also collaborate in real-time with other team members, manage feature prioritization, and track progress within the Gantt view. This helps you oversee complex plans with ease — so you can spend less time formatting and organizing and more time collaborating and building.