
Report on project health
Assess the progress of projects in real time, surface delivery risks, and optimize delivery workflows
Assess the progress of projects in real time, surface delivery risks, and optimize delivery workflows

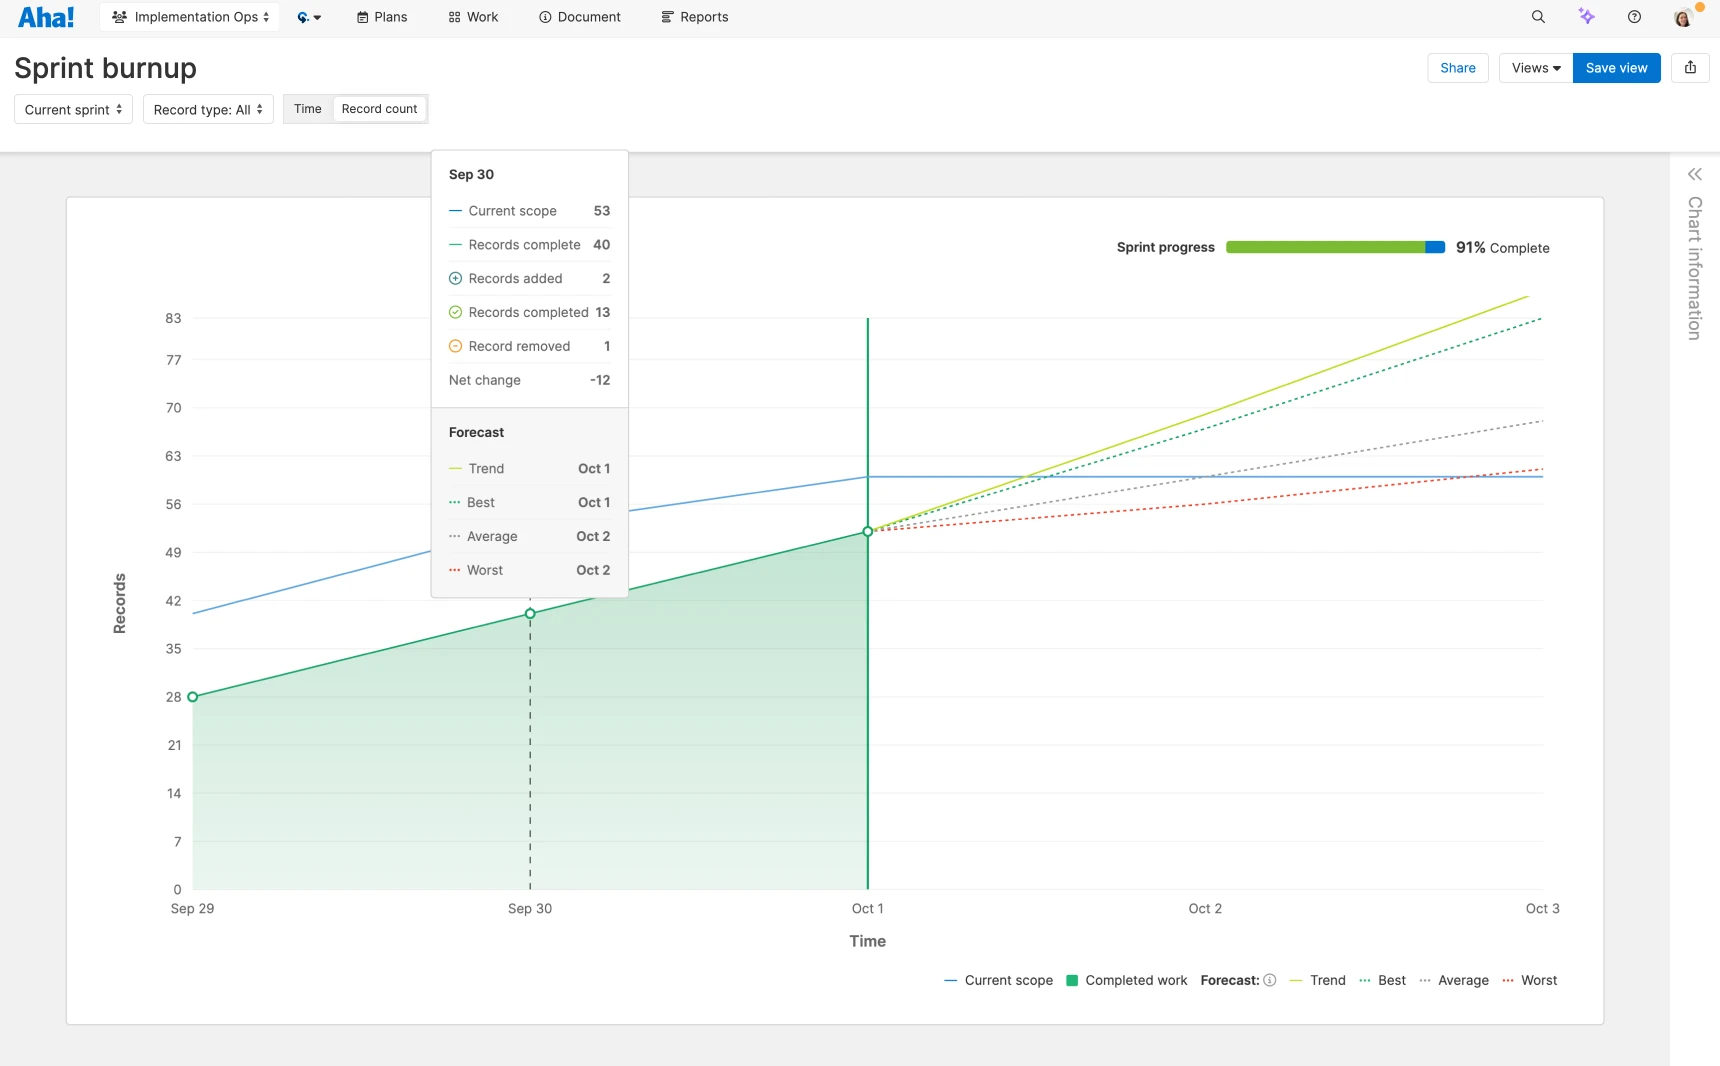
Keep delivery on track. Monitor status and percent complete on the timeline view to stay on schedule. Use the burndown chart to compare the team's actual progress against the ideal pace. And see the impact of scope changes on the burnup chart — so you can forecast when work will actually be completed to set stakeholder expectations.
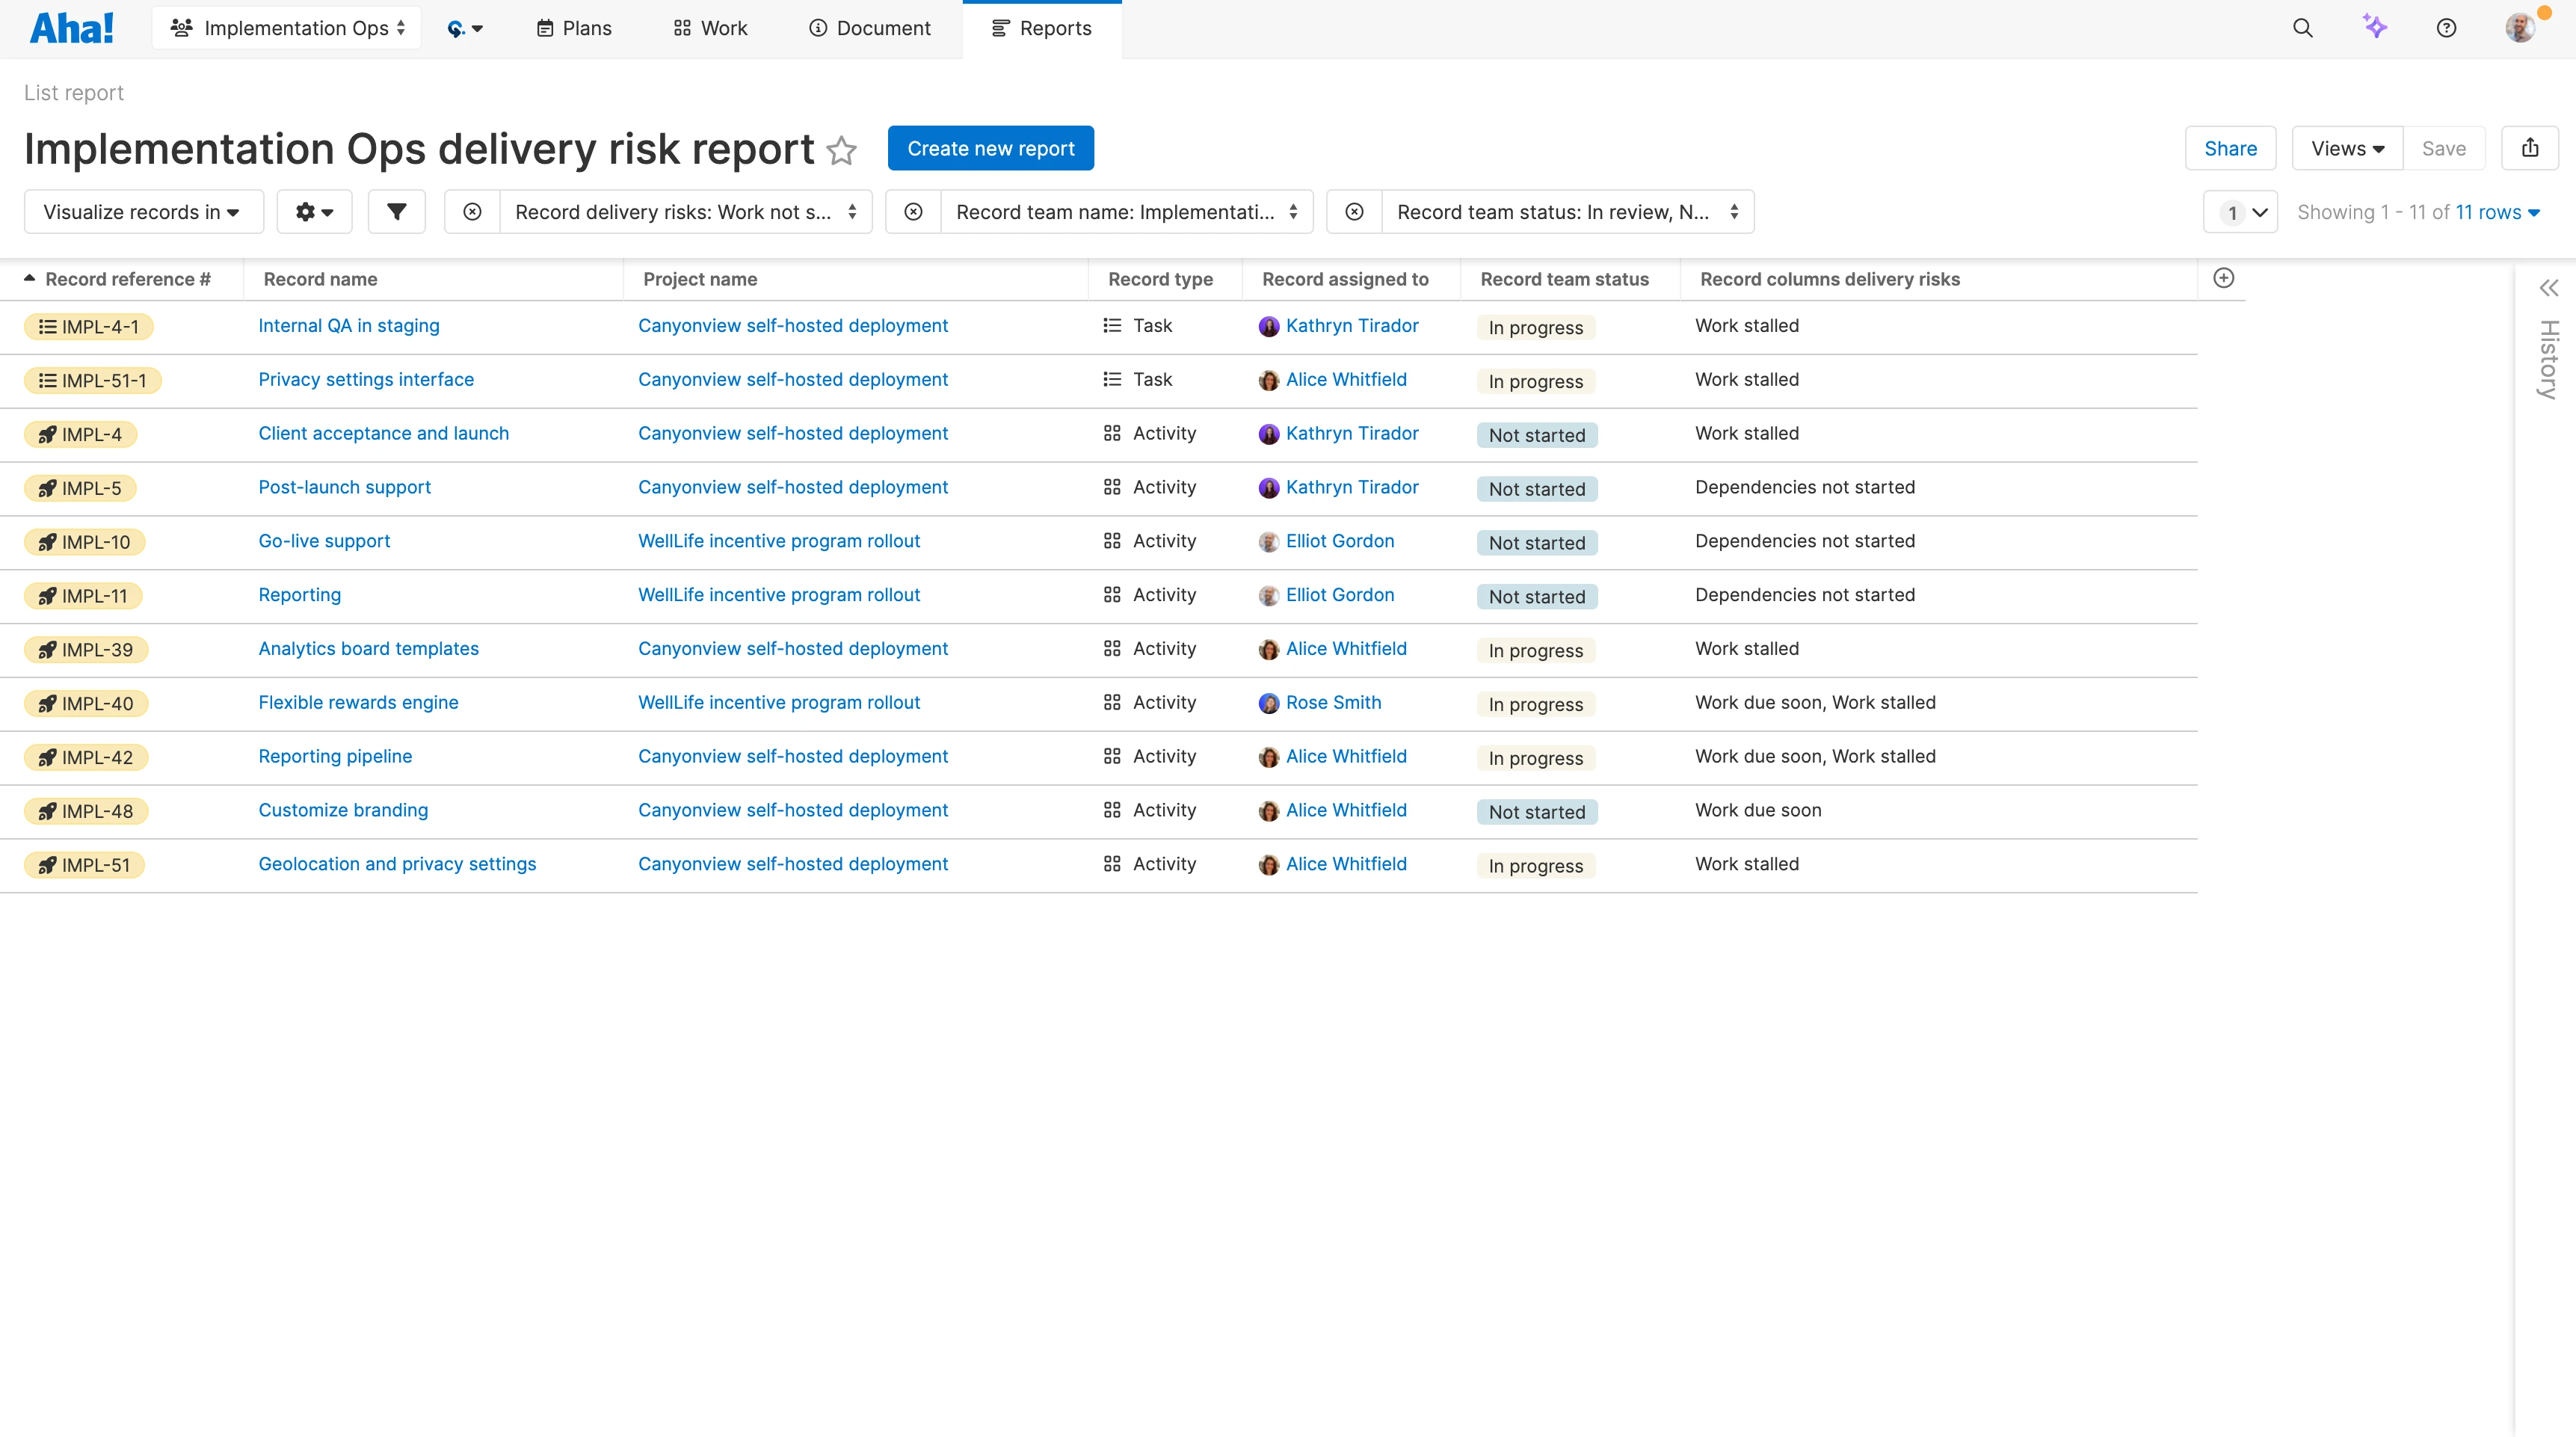
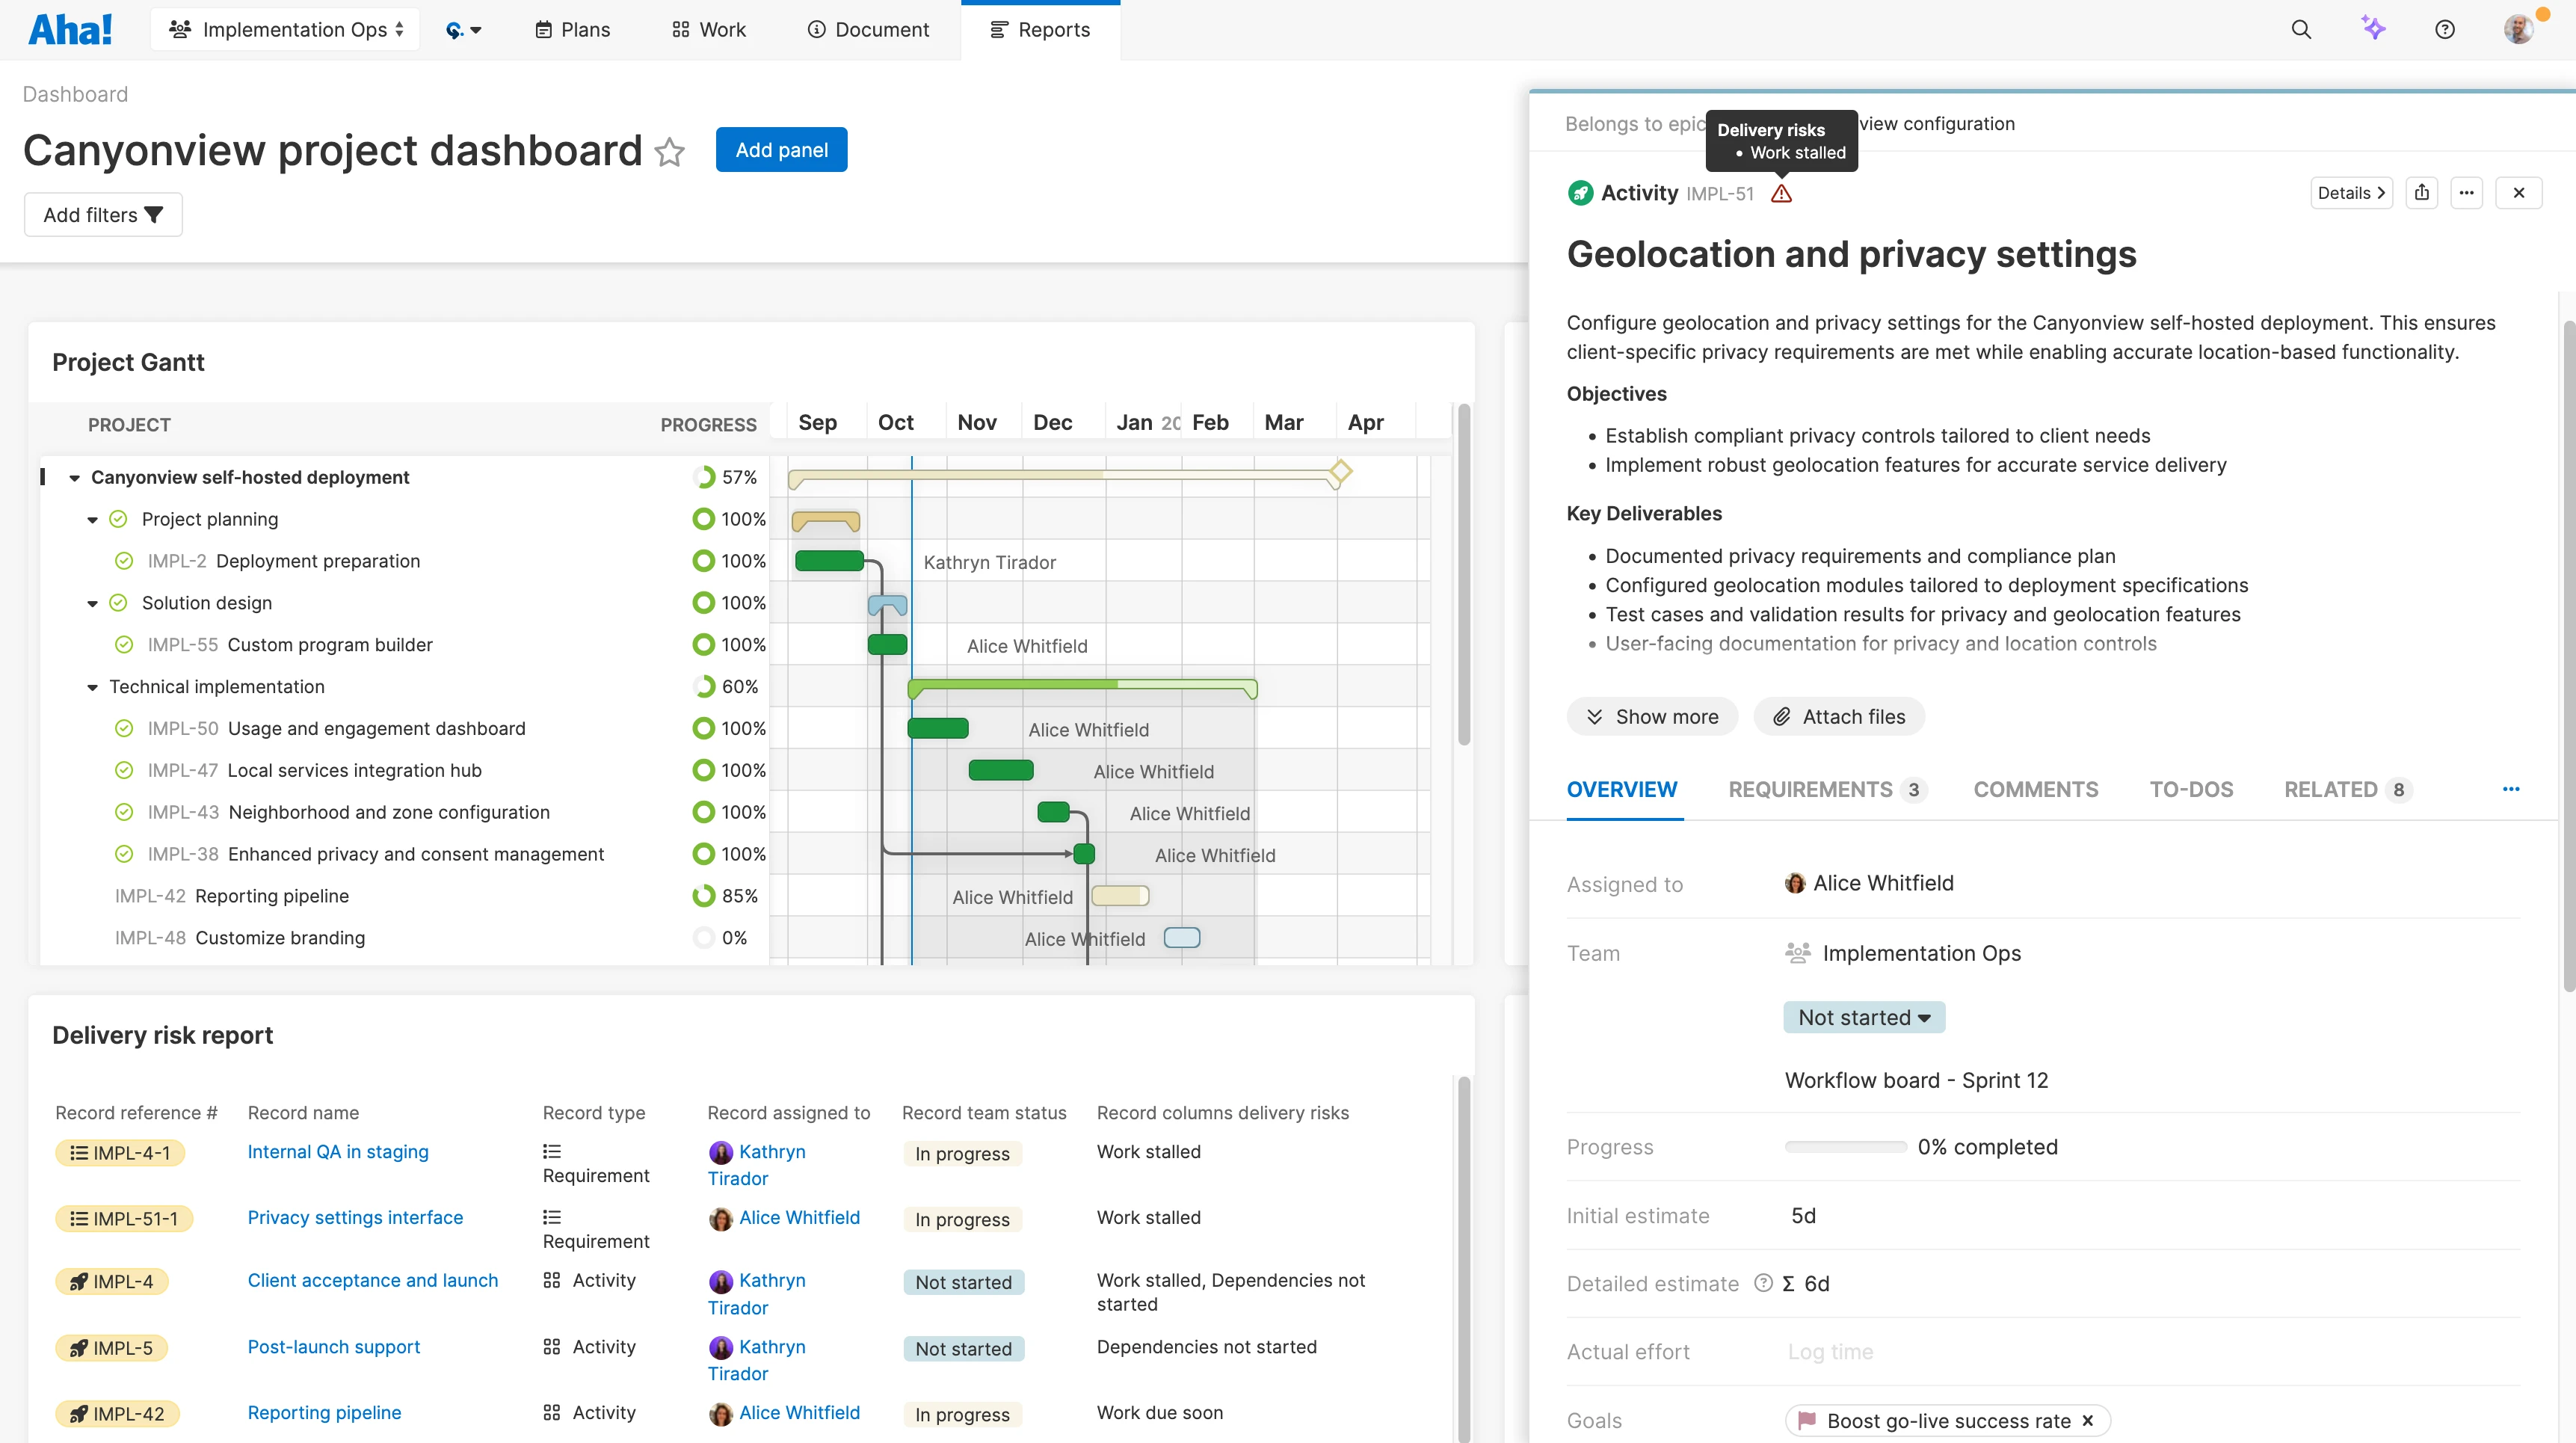
Instantly see when a project is at risk. Choose the issues you want to track — including past-due dependencies, stalled work, and status churn. Then, use the delivery risk report to immediately spot which activities are at risk and why. Drill in to understand the details so you can proactively resolve potential problems.
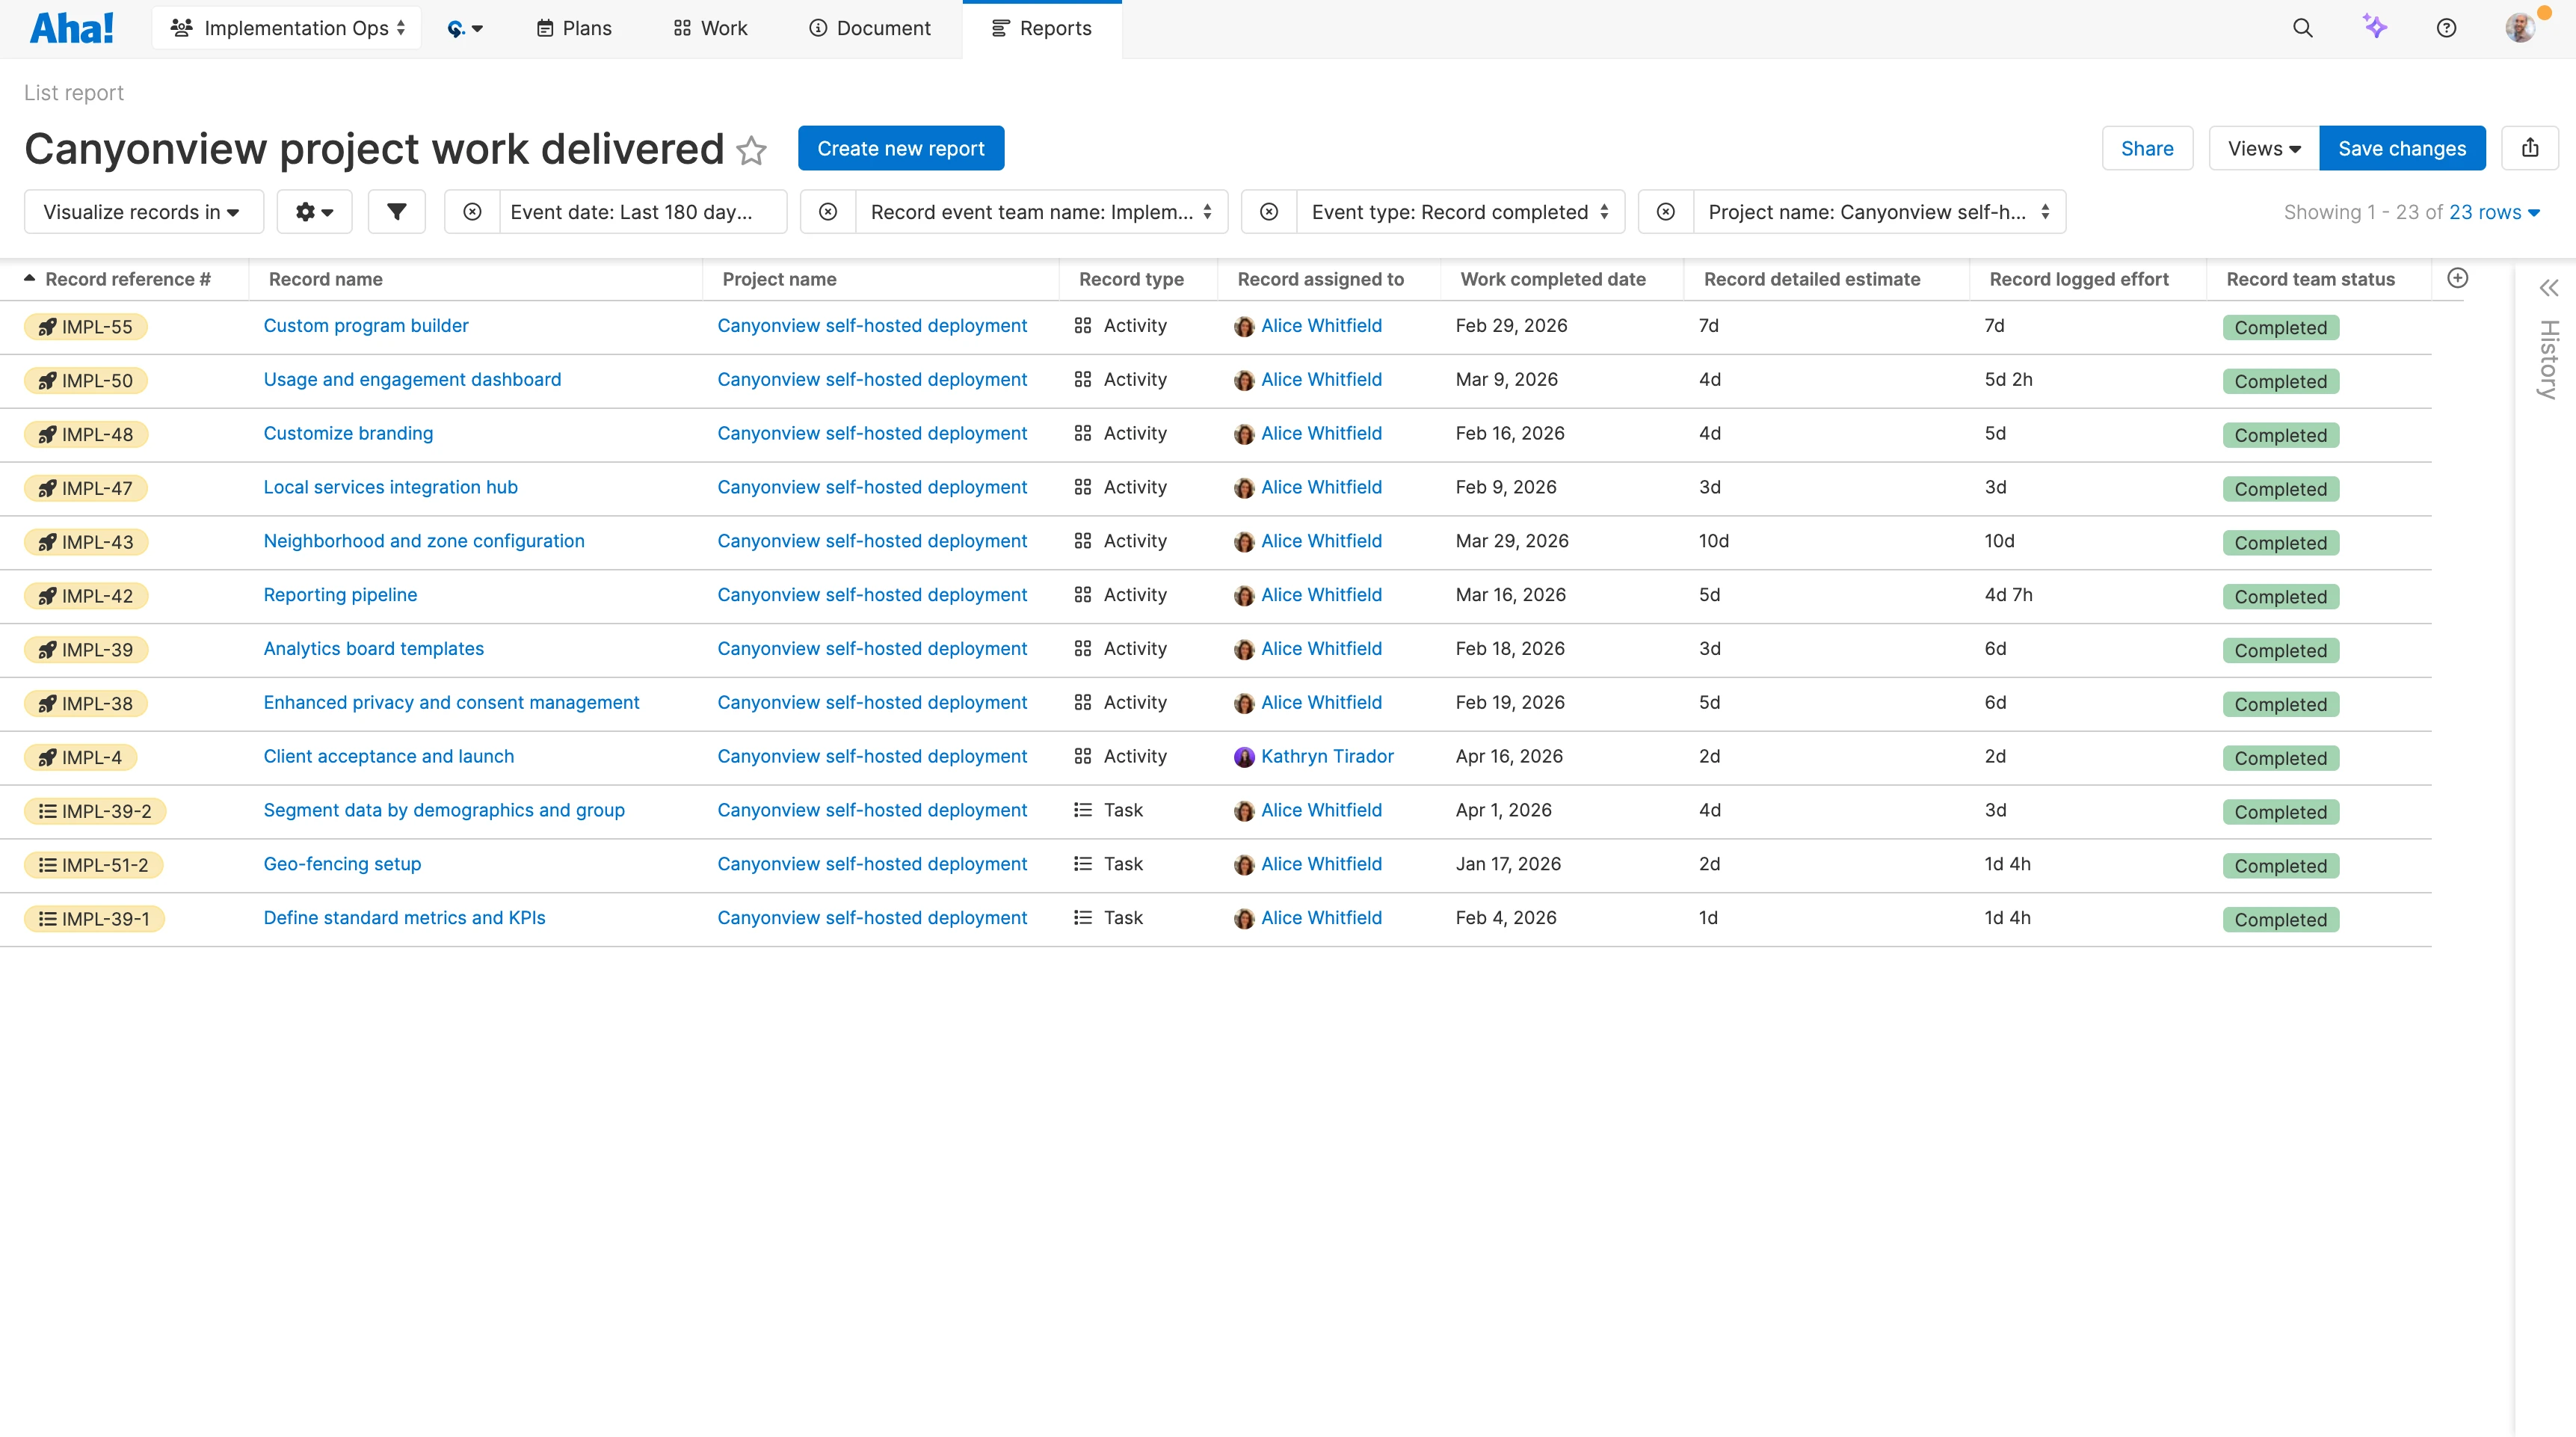
Showcase the team's contribution. Create a work delivered report to show completed activities by project or type. If you use Aha! Teamwork with Aha! Roadmaps, project progress automatically rolls up to strategic goals and initiatives — providing a complete picture of momentum against the overall business plan.
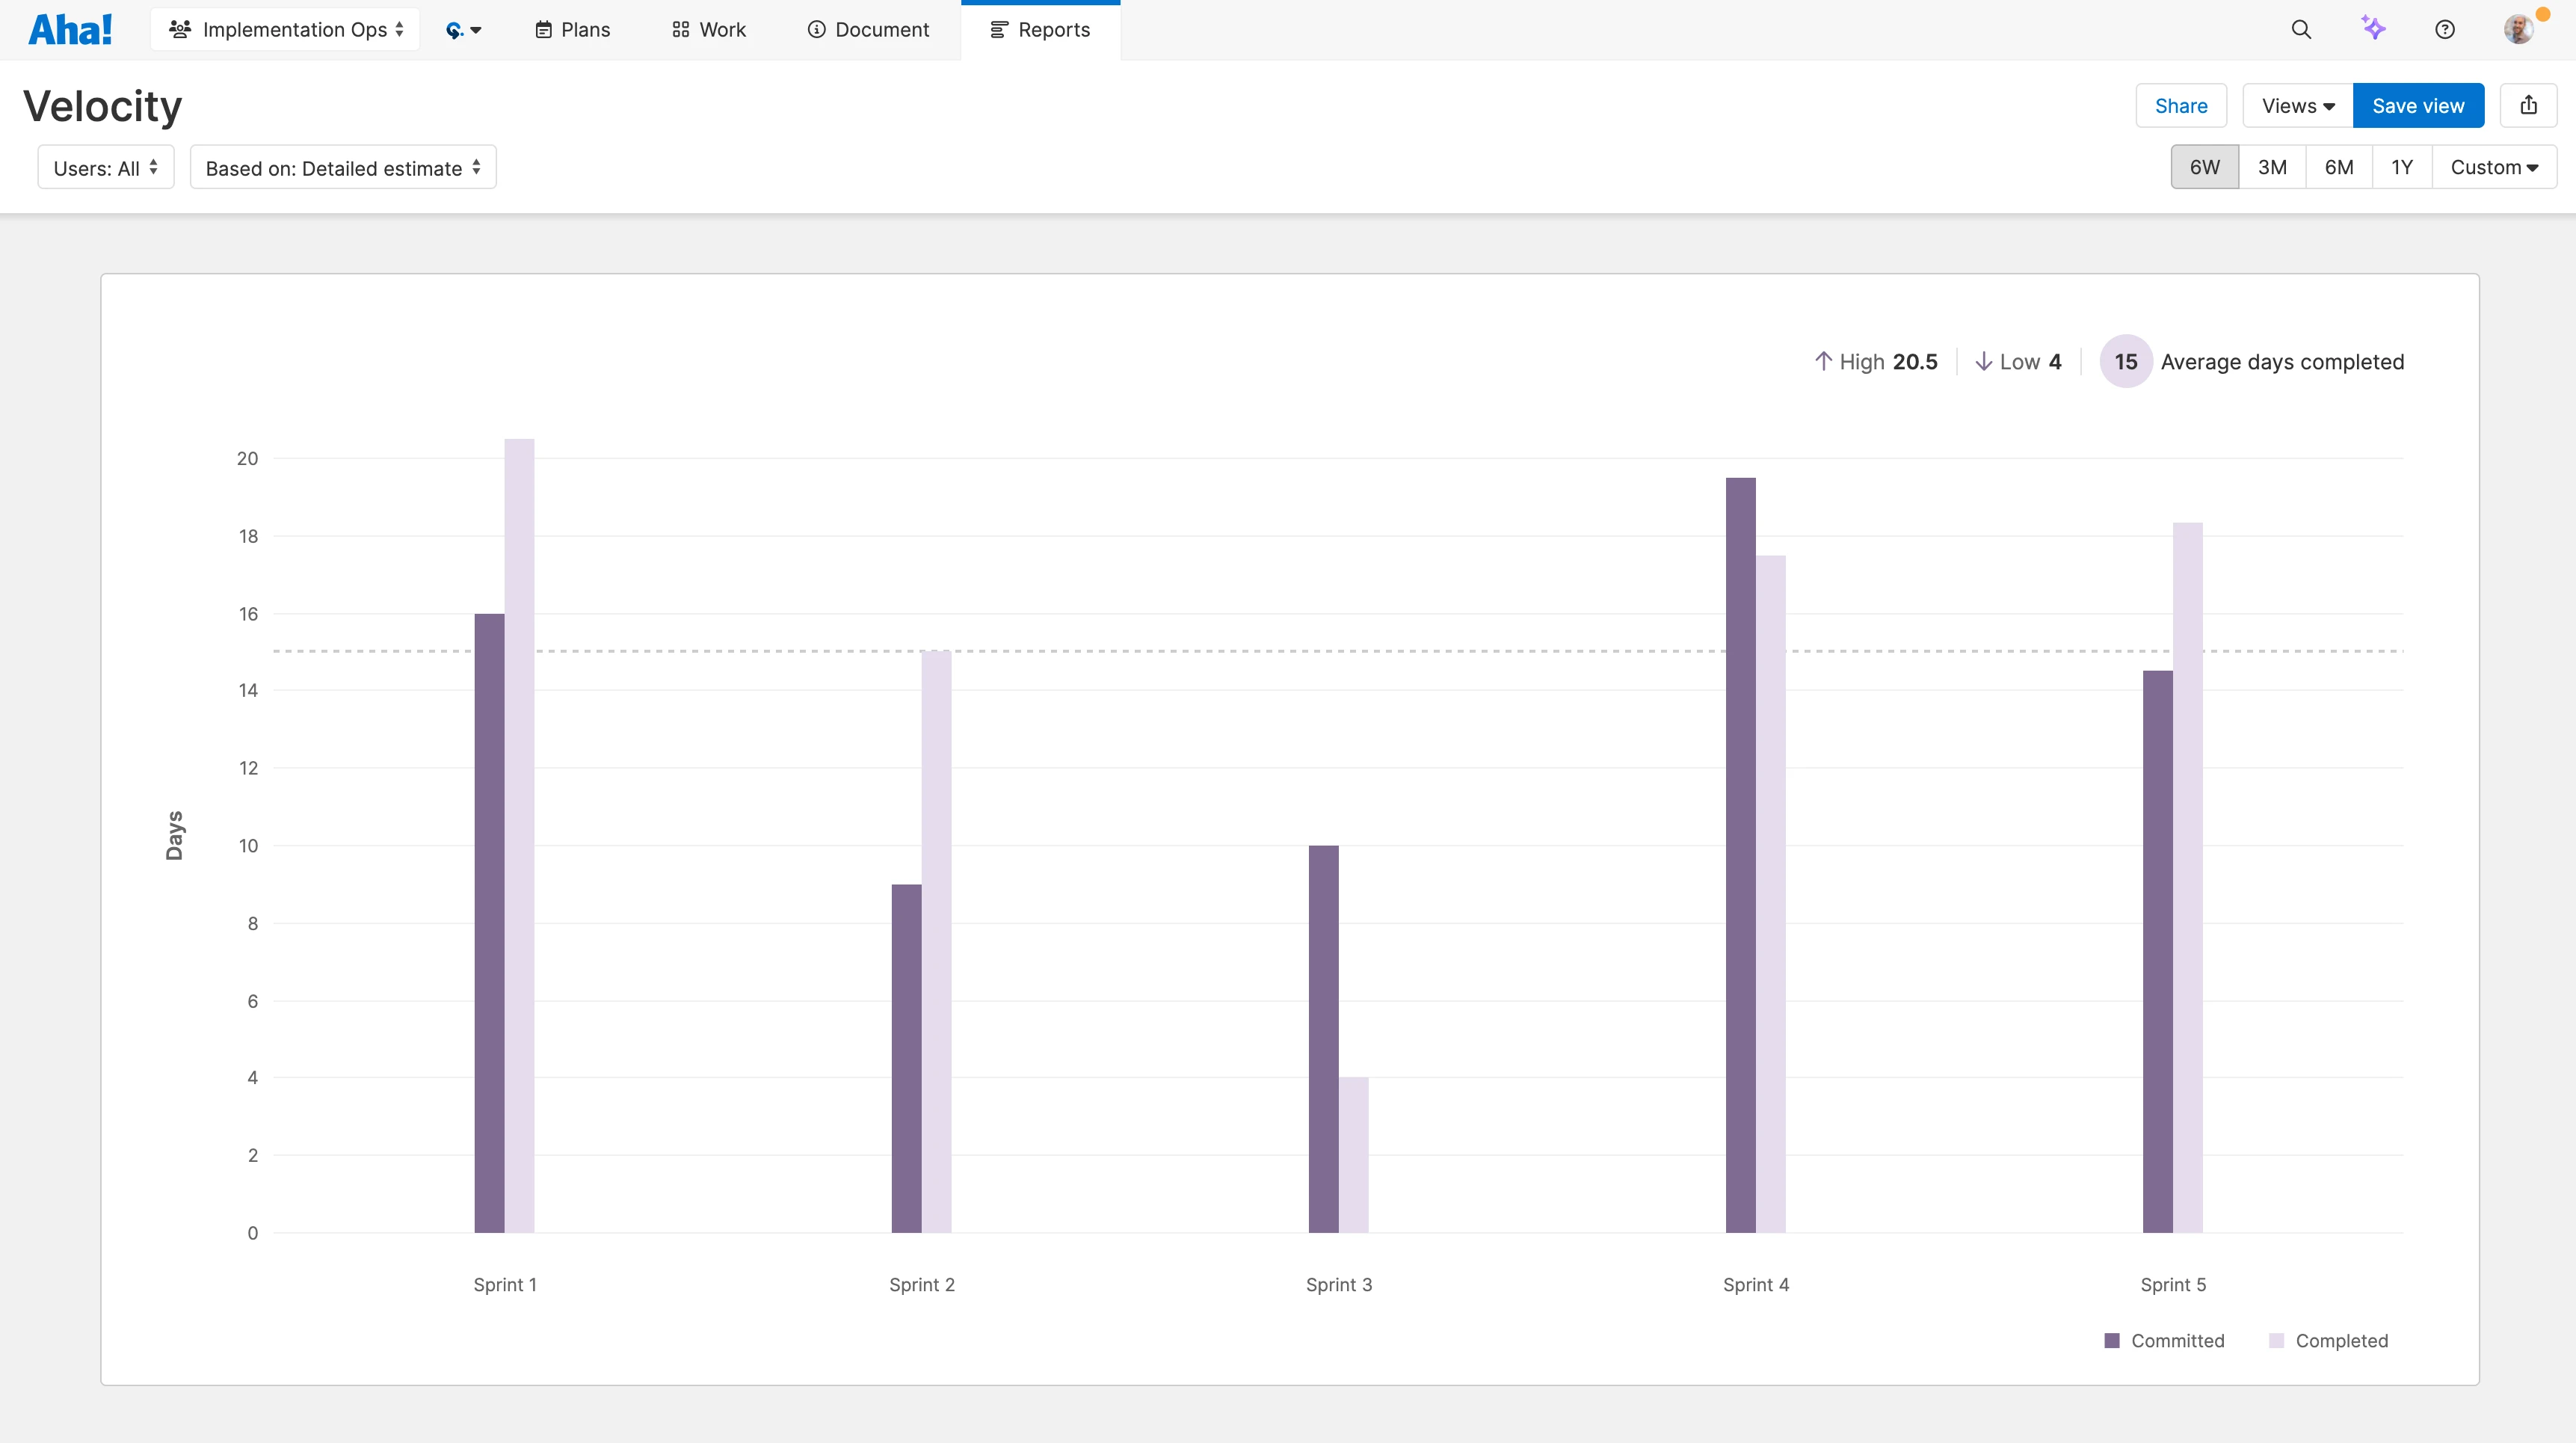
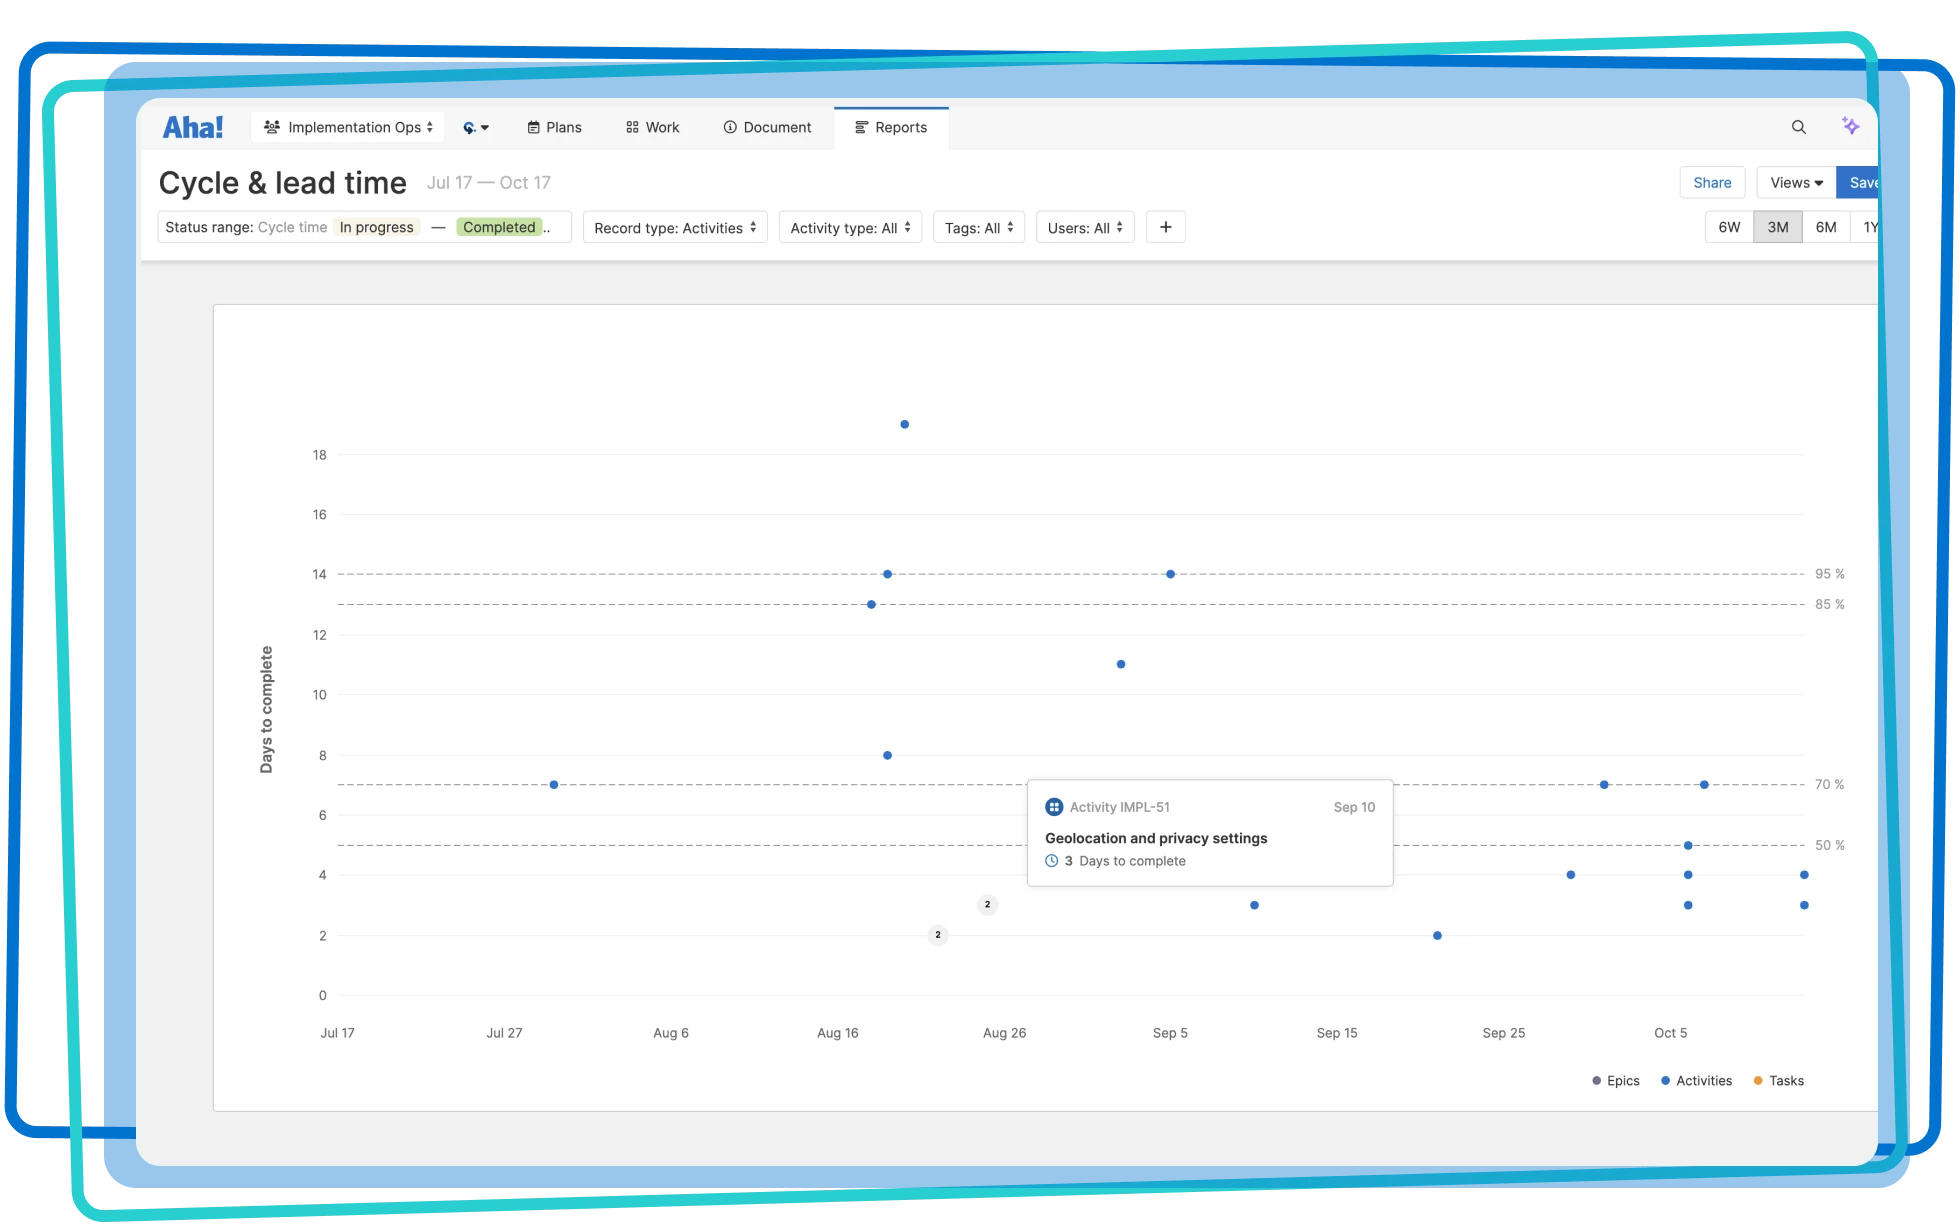
Optimize team performance. Access powerful reports to measure velocity, throughput, and lead and cycle time. Improve how work flows through your process with the cumulative flow diagram and workflow heatmap. These insights help you quickly spot delays — so you can deliver projects faster.
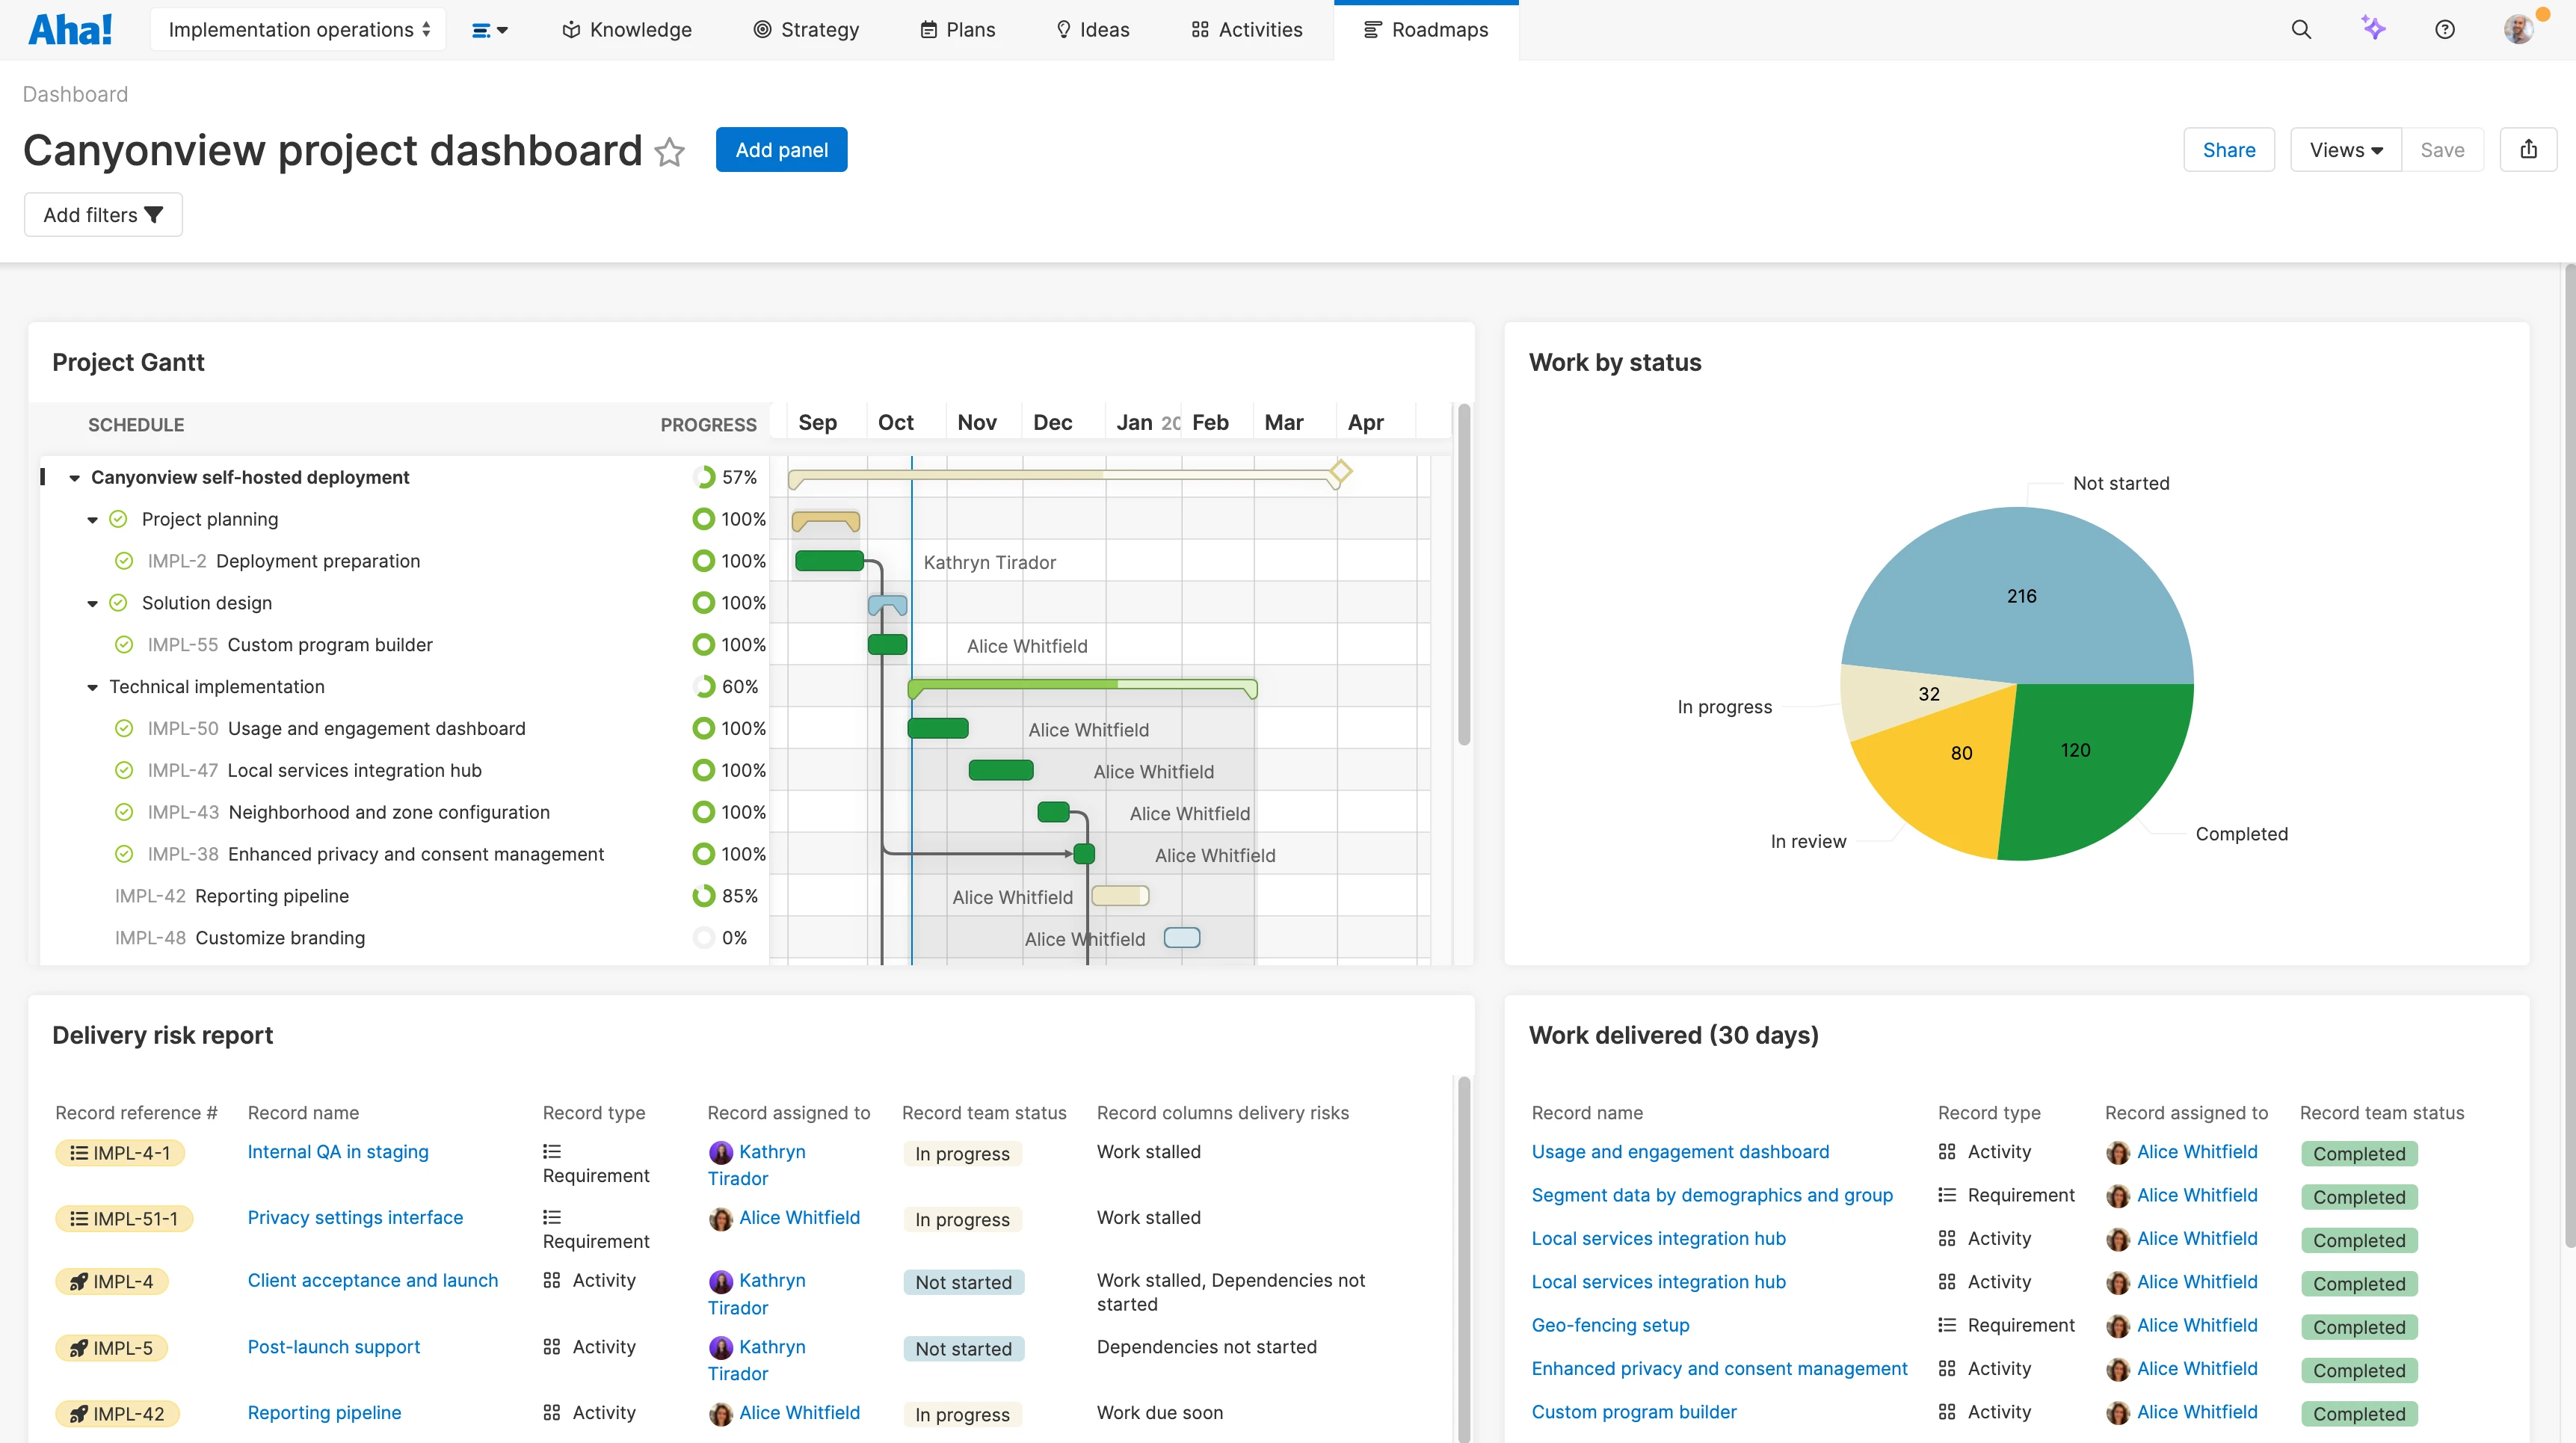
Analyze project KPIs. Aha! Teamwork and Aha! Roadmaps share the same underlying reporting engine. This empowers you to combine data from both tools — creating list reports, pivot tables, and charts to gain the insights you need. Bring multiple reports together in a single dashboard to monitor project health in one view.